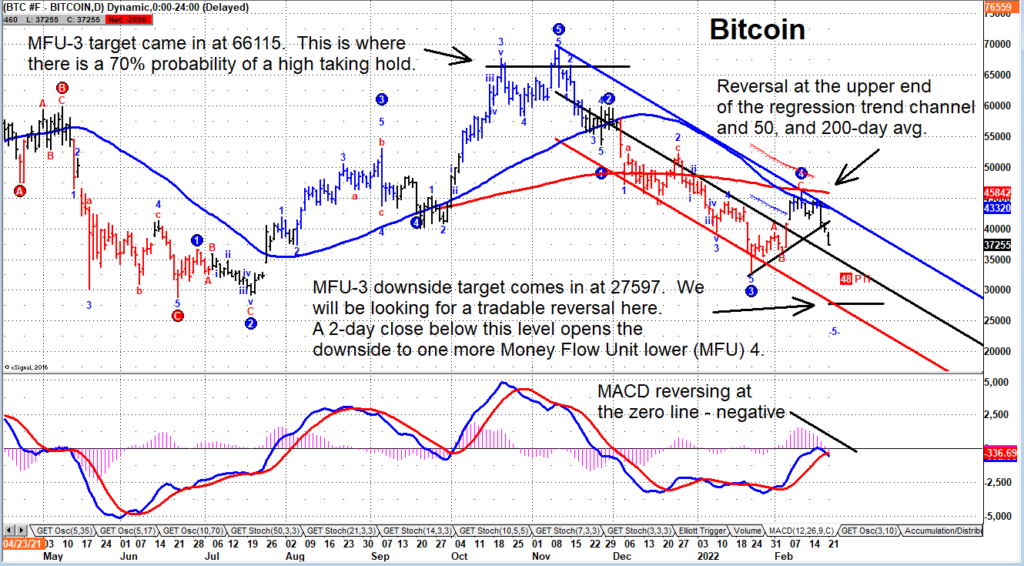
As many of you know, my work is based on money flow indicators. We recently applied this to bitcoin trading to see what sort of downside projections would come up.
Bitcoin has been in decline for several weeks now.
Within this decline, we saw a reversal at the declining 50 and 200-day moving averages and the upper end of the regression trend channel. Wave structure is suggesting that price could take out the January low.
As well, the MACD momentum indicator is turning down from the zero line, which is a bearish setup. Our money flow unit level 3 (MFU-3) support comes in at 27597. This is where we will look for a tradable reversal and rally. That said, if price closes below this level for 2 days then it could indicate further downside to an MFU-4 level (tbd).
Bitcoin Price Chart

Twitter: @GuyCerundolo
The author or his firm have a position in mentioned securities at the time of publication. Any opinions expressed herein are solely those of the author, and do not in any way represent the views or opinions of any other person or entity.


