The past four trading days have held roughly the same price areas within the major indices.
Specifically, the S&P 500 (SPY) and the Nasdaq 100 (QQQ) have similar tight price action.
When watching for larger than average price moves, tight or consolidative price action can often lead to large range days.
Small range days can also be accompanied by lower amounts of volume which help to support a big move because when liquidity begins to dry up, it takes less buying or selling to move a symbol.
This is where it pays to watch for consecutive days with lower volume and tight price action when looking for a potential major price move.
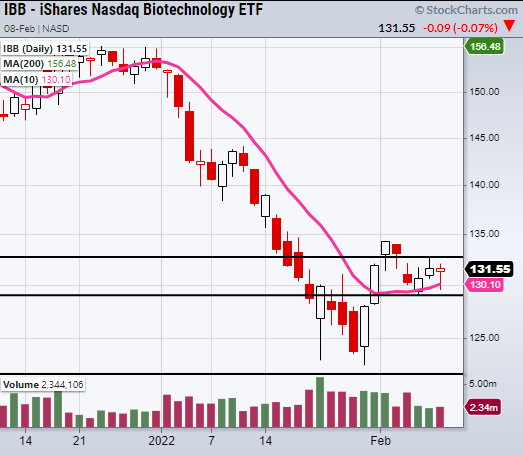
With that said, one sector that is showing tighter price action along with lower volume is the Biotech ETF (IBB).

Looking at the above chart, IBB has traded within a small range of $129.09 to $132.77 in the past four trading days.
With a tight support area, we can watch for IBB to clear its mini range high and hold support from the 10-Day moving average at $130.10 and the recent low at $129.09.
However, while tight ranges can be easy to trade since they have obvious defined entry and risk areas, we must also be careful about large moves in the opposite direction. A quick exit once key support is broken is the best plan when trading tight support and resistance areas.
Stock Market ETFs Trading Analysis & Summary:
S&P 500 (SPY) 452.97 to clear as minor breakout point.
Russell 2000 (IWM) 203.90 resistance.
Dow (DIA) 355.01 the 50-DMA to clear.
Nasdaq (QQQ) 362 resistance
KRE (Regional Banks) Watch to hold over 75.76
SMH (Semiconductors) 284 resistance. 270 to hold.
IYT (Transportation) Looking to clear the 50-DMA next at 266.61
IBB (Biotechnology) 132.77 to clear.
XRT (Retail) 83.14 resistance.
Twitter: @marketminute
The author may have a position in mentioned securities at the time of publication. Any opinions expressed herein are solely those of the author and do not represent the views or opinions of any other person or entity.


