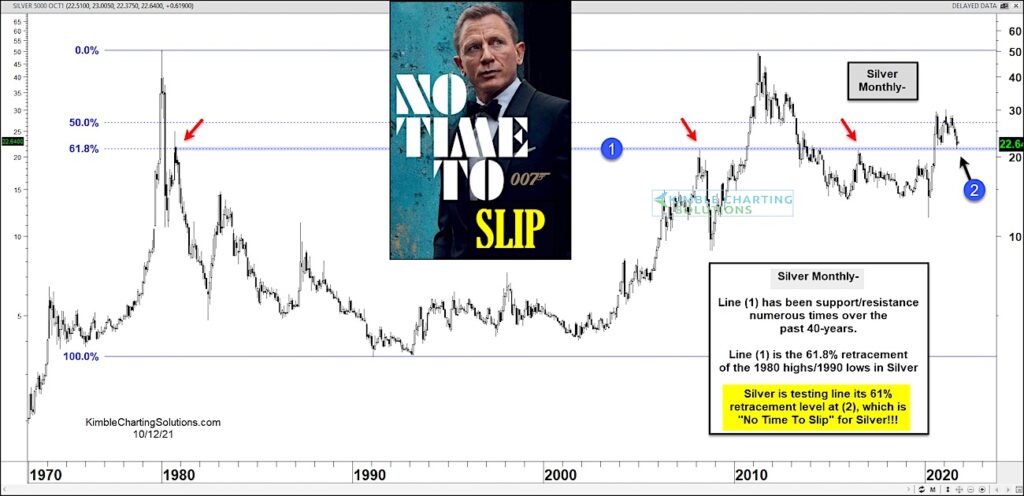
Silver futures recorded a major bullish price reversal in early 2020, leading to a multi-month rally that pushed prices as high as $30.
Since peaking out earlier this year, silver futures have toiled in an $8 trading range and are facing a BIG test right now!
As you can see in today’s long-term “monthly” chart, Silver futures are testing a major price support/resistance line at (1). This has served as a pivot for the past 40 years!
Line (1) is also the 61.8% Fibonacci retracement of the 1980 price high to 1990’s price low.
Silver is testing this line once again at (2) — this time is comes in the way of support. Will this area hold… or will it give way to a bigger decline?
Let’s just say that it is “no time to slip” for Silver! Stay tuned!
Silver Futures “monthly” Chart

Note that KimbleCharting is offering a 2 week Free trial to See It Market readers. Just send me an email to services@kimblechartingsolutions.com for details to get set up.
Twitter: @KimbleCharting
Any opinions expressed herein are solely those of the author, and do not in any way represent the views or opinions of any other person or entity.


