 By Andrew Nyquist
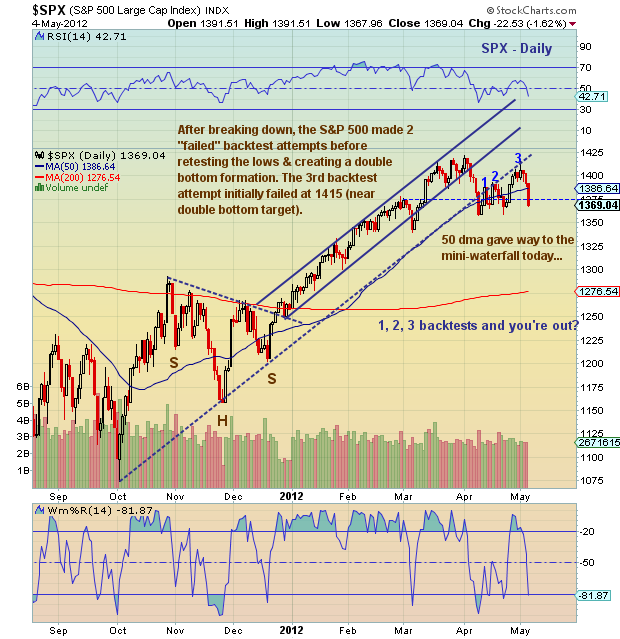
The past few days are a good reminder of why we define our risk when actively investing. Lots of folks asking what happened today. Well, the best way to answer that question is by focusing on the charts and analyzing the technicals…
What many people don’t realize is that emotion/sentiment shows up everyday in charts. In fact, price movement is a one of the best indicators/reflections of psychology. So what happened?
After breaking down in April, the S&P 500 formed a double bottom at 1358 and accelerated higher into month end. This bounce was stealth and bullish sentiment quickly returned… perhaps too quickly. The goodness flowed into Tuesday, mind you “Turnaround Tuesday.” The reversal that day was a strong warning. It occurred at 1415, right underneath the broken uptrend line. Yep, another failed backtest. In fact, this was the 3rd failed backtest. This has led to another waterfall of selling down to the crucial 1370 support line (2011 highs and March breakout area).
With uncertainty over French and Greek elections, the market is likely to remain volatile. Ball is in the bears court now. It’s their game to lose near term.
———————————————————
Twitter: @andrewnyquist and @seeitmarket Facebook: See It Market
No position in any of the securities mentioned at the time of publication.
Any opinions expressed herein are solely those of the author, and do not in any way represent the views or opinions of his employer or any other person or entity.


