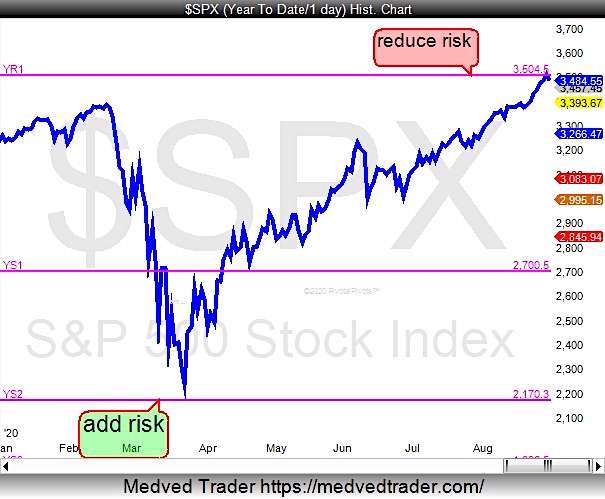
The stock market has had quite a rally since the March lows.
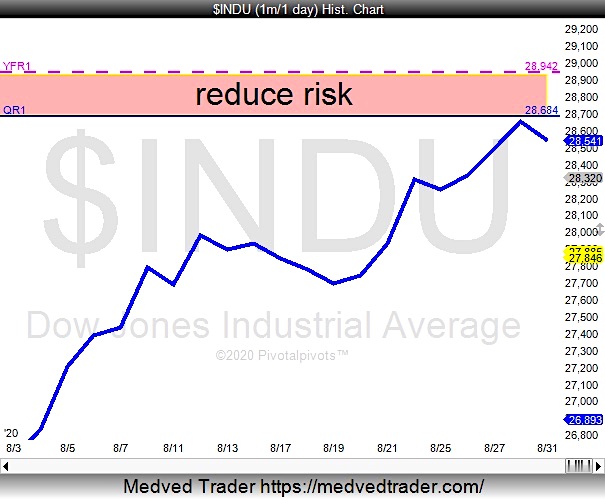
As the calendar turns to September, the S&P 500 Index (SPX) and Dow Jones Industrial Average (DJIA) are testing price resistance at their Yearly R1 pivot points.
The stock market low this year was on the Yearly S pivot points.
This looks like a good spot for investors to reduce or hedge risk going into the presidential election. See charts below.
I’m looking for a BIG pullback to start in September!
Check out my new video “the biggest reversals happen at the yearly pivots“.
S&P 500 Chart with Pivot Points

Dow Jones Industrial Average with Pivot Points

Twitter: @Pivotal_Pivots
The author may have a position in mentioned securities at the time of publication. Any opinions expressed herein are solely those of the author, and do not in any way represent the views or opinions of any other person or entity.


