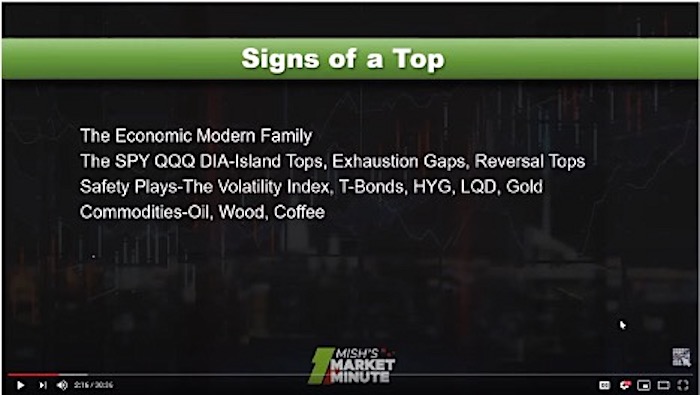
After last Thursday’s nearly 1900-point decline, I recorded a video for StockChartsTV.
Then, on Friday, we saw four distinct trading patterns emerge.
First, many instruments had inside days or traded within the range of Thursday’s trading range. Is this surprising? Nope. As digestion after feasting on the meat of the bulls, is practically mandatory.
Second, several instruments made new 60+ day lows on Thursday and are digesting right near a major moving average.
Third, some instruments simply outperformed, yet tested major moving averages offering a much more sensible risk.
Finally, and here is the stick in the mud, NASDAQ 100 confirmed an island top. Technically, that is a sign of a top. The question is, how much more downside if any, will this island yield?

A classic inside day pattern can be seen on the Dow Jones Industrial ETF chart DIA. Although DIA is currently trading beneath the 200-DMA, since Thursday’s high sits right on the 200-DMA, a break of the inside day pattern would correspond well with a move over Thursday’s high or the 200-DMA.
On the other hand, a break below Thursday’s low, would suggest significantly more downside.
An instrument that made a new 60+ day low, followed by an inside day and sitting on a major moving average is Space or Virgin Galactic. Therefore, a move over last Thursday’s high offers a great risk to under the 200-DMA. And like DIA, if it breaks Thursday’s low, it also breaks the 200-DMA suggesting lower prices ahead.
An instrument holding a major moving average that did not sell off as much as the indices did is Baidu BIDU. That also offers a great risk to under the 200-DMA. And again, you do not want to see this break under last Thursday’s low.
Alas, we must go back to the stick in the mud, or NASDAQ 100 and its island top. An island top leaves literally an island. An instrument gaps up and can hold that gap up for one or more days. Then, what makes it an island, is that it will then gap down, leaving the price standing alone, surrounded by space (water), like an island. QQQs had a one-day island as last Thursday it gapped down.
Statistically, the overall performance rank for island top breakdowns is 38 out of 53 (tops). That means, the downward pressure on the market could outweigh the other three more potentially bullish patterns.
Nevertheless, QQQs could also wind up to be one of 15 out of 53 times the island does not work and the gap gets filled.
I go through a lot of these charts during the 30-minute presentation I did for StockchartsTV.
1800 Point Drop: Something Bigger or a Buy? | Mish’s Market Minute (6.12.20)
S&P 500 (SPY) Like BIDU, held the 200-DMA at 300-now pivotal
Russell 2000 (IWM) 142 resistance with support at 129.50 the 50-DMA
Dow (DIA) 251.38 has to hold after the inside day. A move over 263.35 clears the 200-DMA 263
Nasdaq (QQQ) Island top-rare-will most likely confirm unless trades to 244.51. Support 220
KRE (Regional Banks) 41.45 resistance support at 36.15
SMH (Semiconductors) Inside week-so there’s that 139.78 last week’s low-150 resistance
IYT (Transportation) 158 support to hold or then see 150. 168 resistance
IBB (Biotechnology) Tested and held the 50-DMA. 126 key support
XRT (Retail) Landed right on the 200-DMA so 40.50 held and must keep holding
Volatility Index (VXX) Confirmed the bullish phase. 34.50 support
LQD (iShs iBoxx High yield Bonds) 132 pivotal
Twitter: @marketminute
The author may have a position in the mentioned securities at the time of publication. Any opinions expressed herein are solely those of the author, and do not in any way represent the views or opinions of any other person or entity.


