On Tuesday, Wayfair (W) rallied over 23% on the day after posting better than expected earnings. The company benefited from the ongoing shelter-at-home trend.
This news also sent other home décor stocks including Etsy (ETSY) higher in Tuesday’s trade.
ETSY closed the day up over 7%. Given this background, let’s take a look at the weekly charts.
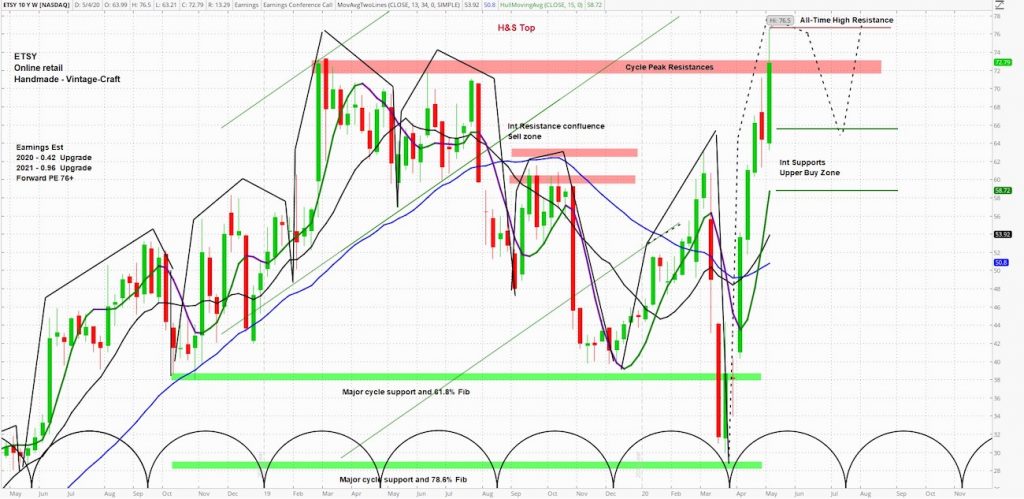
Etsy (ETSY) Chart

At askSlim we use technical analysis to evaluate price charts of stocks, futures, and ETF’s. We use a combination of cycle, trend and momentum chart studies, on multiple timeframes, to present a “sum of the evidence” directional outlook in time and price.
askSlim Technical Briefing:
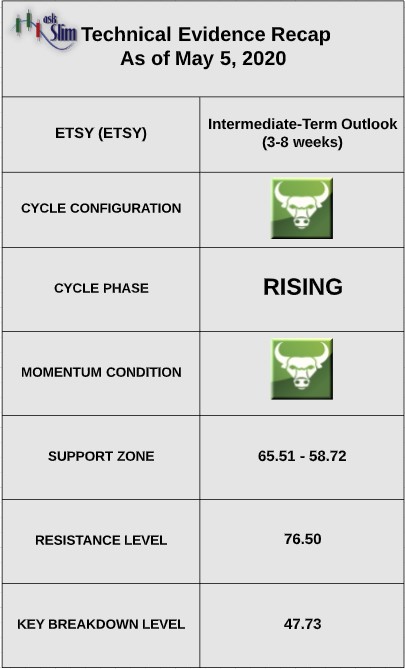
The weekly cycle analysis suggests that ETSY is in a rising phase in an overall very bullish pattern. The next projected intermediate-term low is due in July. Weekly momentum is positive.

On the upside, the only visible resistance is the all-time-high that the stock made this week at 76.50. On the downside, there is an intermediate-term support zone from 65.51 – 58.72. For the bears to gain control of the intermediate-term, we would need to a close below 47.73.
askSlim Sum of the Evidence:
ETSY is in a very bullish weekly cycle pattern with positive momentum. Given these conditions, we would expect sell-offs to be limited to the intermediate-term supports beginning at 65.51. Note: ETSY reports earnings on 5/6/2020 after-hours.
TABLE
Interested in askSlim?
Get professional grade technical analysis, trader education and trade planning tools at askSlim.com. Write to matt@askslim.com and mention See It Market in your email for special askSlim membership trial offers!
Twitter: @askslim
Any opinions expressed herein are solely those of the author, and do not in any way represent the views or opinions of any other person or entity.


