 By Andrew Nyquist
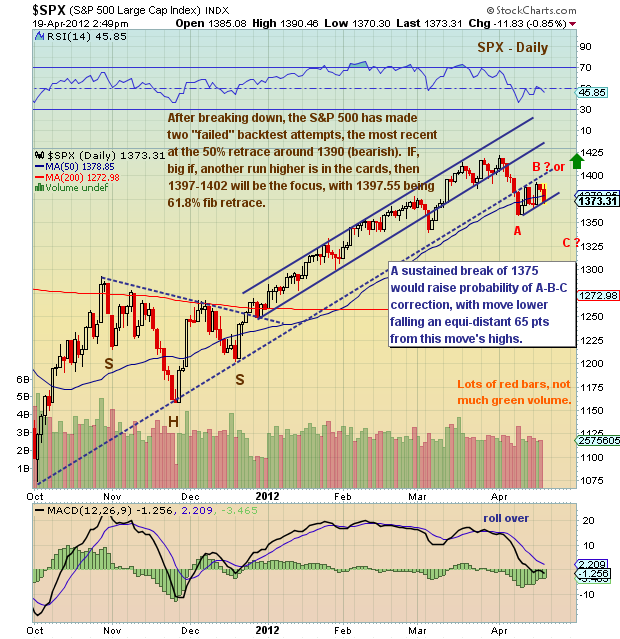
Over the past several days we have witnessed a classic break down and backtest on the S&P 500 chart. So what gives? And what should bulls and bears be looking for going forward?
Well, first of all, the bulls already have 2 strikes against them and it’s looking grim. The index has failed twice in backtesting the broken trend line. And, although it could continue to ride underneath the broken trend line for a while longer, bulls need some urgency now. Further, if the index is going to produce a near term move to new highs, it will need to get through the rising backtest line on volume — And with two “fails,” it’s either three times a charm or down we go. And “down we go” is currently in the lead.
Why? The move through the 50 day moving average should be viewed as a yellow flag. And further, the move under 1375 (March breakout area and current “mini” uptrend line) intraday is ominous. If the move is sustained, it would likely indicate that the “C” wave of an A-B-C correction has begun (minimum) . This would bring the bears out of hibernation.
If Above 1390 (which is also the 50% fibonacci retrace level) comes 1397-1402. Note 1397.55 is the 61.8% fib retrace.
If Below 1375, then watch 1360, then 1330 – 1340 area. IF lower, 1333 could be a magnet as it represents a double off 2009 lows.
———————————————————
Twitter: @andrewnyquist and @seeitmarket Facebook: See It Market
No position in any of the securities mentioned at the time of publication.
Any opinions expressed herein are solely those of the author, and do not in any way represent the views or opinions of his employer or any other person or entity.
Your comments and emails are welcome. Readers can contact me directly at andrew@seeitmarket.com.


