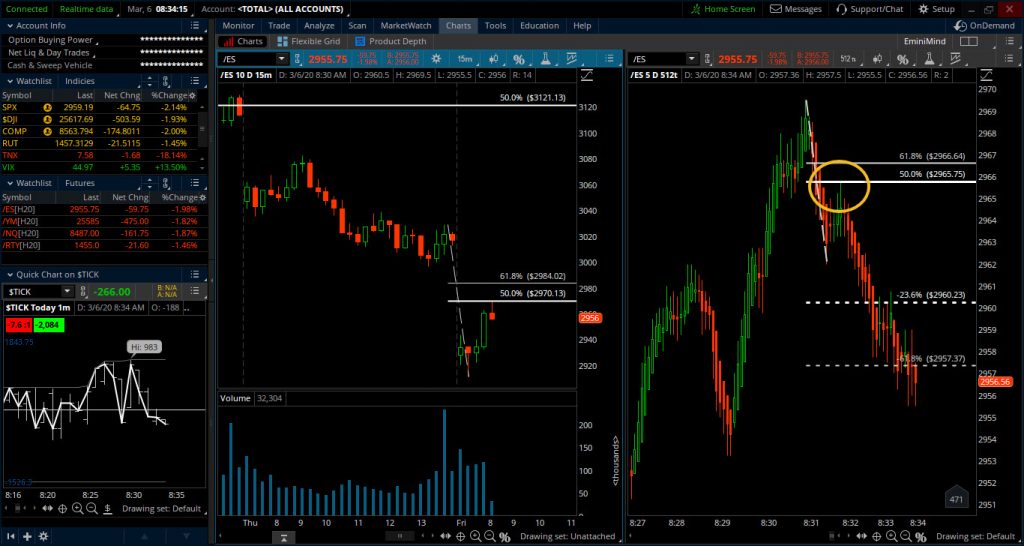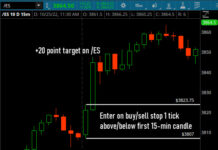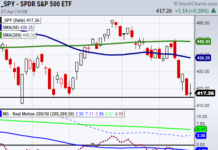
Looking at multiple time frames is a helpful way to verify support or resistance before placing a trade.
When looking at an intraday setup, the 15-min chart makes for a great “higher” time frame to start with.
After seeing the market pause and reverse at a resistance point that’s when I turn to the smaller time frame (in this case, the 512 tick chart) to execute my trade.
The support or resistance level could be anything from a pivot point, prior high or low, or 50% retracement it really doesn’t matter. The key is that you start with the larger time frame because that carries more weight.
When trading with the trend, I always trade in the same direction of the higher time frame.

As an aside, when trading counter trend, the change in direction is going to first be visible on the smaller time frame and then work it’s way up to the larger time frame so in that situation, I would look to the smaller time frame as my “reversal” signal and execute there.
Multiple time frames can be helpful for verifying support and resistance level, just be sure not to over-complicate things.
Twitter: @EminiMind
Any opinions expressed herein are solely those of the author, and do not in any way represent the views or opinions of any other person or entity.


