Yesterday we took an in depth look into Semiconductors Sector ETF (ticker: SMH) and the question of “is SMH offering us flowers, but with poison thorns?”
Our conclusion was “For actionable information, should SMH break under 118, that is a minor breakdown. A move under 115 is a major breakdown. Not only does that break the higher lows pattern, it also breaks the 50-DMA and very likely the spine of our dear sister.”
It was a timely blog as today SMH fell to 116.32 after failing 118 with the early high of 118.75.
Today, I am going to look at a different group – or what we can call our Asian Economic Modern Family of stocks.
With the 8 blacklisted Chinese stocks implemented by the Trump administration, not only is the timing interesting given the trade talks scheduled for October 10, it also has an impact of the overall macro look of the US market.
Some of these stocks are traded in China only.
Alibaba (ticker: BABA) trades in the U.S.
I also want to look at two ETFs – Hong Kong (ticker: EWH) and China (ticker: FXI) as a next best way to track the stocks we in the U.S. do not trade.
In FXI, the heaviest weighted stock is China Construction Bank, with Tencent Holdings Ltd, second. Tencent is the world’s sixth-largest internet company by revenue.
In EWH, the heaviest weighted stock is the AIA Group Ltd, the largest public listed pan-Asian life insurance group with a weight of 23.31%.

Far second is Hong Kong Exchange and Clearing or the Stock Exchange of Hong Kong and fourth largest stock market in the world.
It has a weight of 7%.
What does our Asian Family of stocks have to say about the U.S. markets and what can we expect going forward?
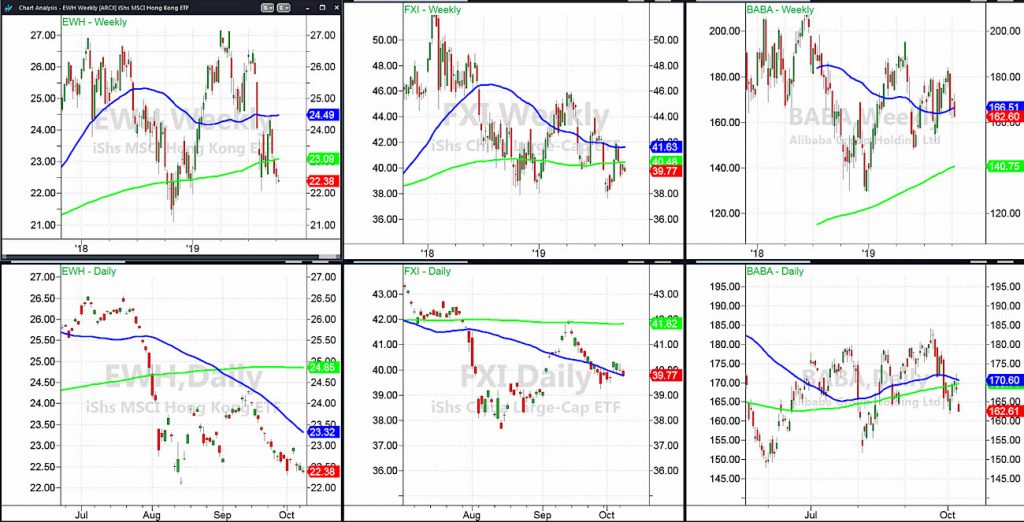
Beginning with Alibaba (BABA), far right, this week, it entered a weak caution phase on the weekly chart. I say weak because the slope on the 50-weekly moving average (blue) is still positive.
On the daily chart, BABA is in a distribution phase. With the 50-DMA (blue) fast approaching the 200-DMA, a death cross is probable or the start of a bearish phase.
Similarly to the U.S. market, BABA is trading in a giant trading range. With the August low at 151.85, the caution phase on the weekly chart should strengthen. However, I would expect a rally off of that support, should the price get there.
Given the current range, even with today’s news, interesting that BABA barely broke last week’s low. However, under 160, that August low becomes a target.
On the far left is the Hong Kong ETF. With triple tops on the weekly chart from 2017 and 2019, we see the damage clearer here.
Nevertheless, today’s action held its key support at 22.00.
In FXI, moves down to around 38.00 have been met with buying since the bottom print in December 2018.
On the flip side, unless this can clear back over 41.00, the bias is weak.
This family is telling us a similar story to our own economic Modern Family.
Sellers dominate, but should not get too complacent into support levels.
As I write this, my head spins a bit as so much of the current price levels are based on political posturing, which of course, can change on a tweet.
Although both Families look sick, I’d rather sell into a rally than sell into weakness. Please note-the Family is trading inside last week’s trading range.
And, since the economic plan appears erratically put together, it’s no wonder that so do the prices on these charts.
S&P 500 (SPY) With the selloff, let’s not forget we are still inside the trading range of last week. Support 287 then 284. 290 pivotal.
Russell 2000 (IWM) 146 is the key support, then 144.25
Dow Jones Industrials (DIA) 260 support then 259.00
Nasdaq (QQQ) 185 support then 182.50. 188 big resistance.
KRE (Regional Banks) 50.00 some support then 48.00
SMH (Semiconductors) 115 key to hold with 116 pivotal and 118 resistance.
IYT (Transportation) 175 the big support level then 171.50
IBB (Biotechnology) 95 support.
XRT (Retail) 41.00 50-DMA pivotal resistance with 40.00 support.
Twitter: @marketminute
The author may have a position in the mentioned securities at the time of publication. Any opinions expressed herein are solely those of the author, and do not in any way represent the views or opinions of any other person or entity.


