Natural Gas Futures “weekly” Chart
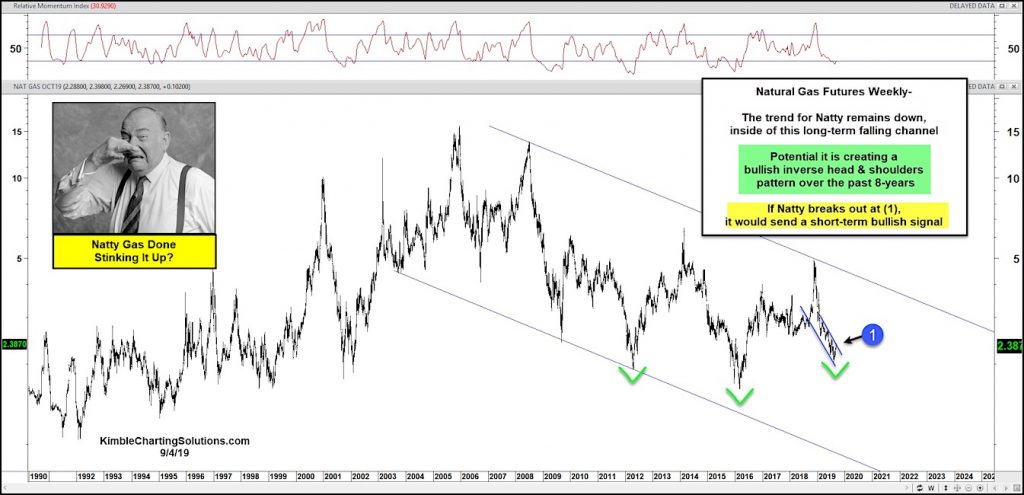
Natural gas prices NYSEARCA: UNG are in a decade long downtrend (see today’s chart).
To put it bluntly, natural gas has been stinking it up for traders for a long time.
The long-term trend for Natural gas remains lower, however there is hope for bulls.
Natural gas is testing its short-term downtrend channel at (1). A breakout now would send a bullish short-term signal. It is also has been creating a bullish inverse head & shoulders bottoming pattern over the past 8 years.
A couple things to keep in mind… stay tuned!
Note that KimbleCharting is offering a 2 week Free trial to See It Market readers. Just send me an email to services@kimblechartingsolutions.com for details to get set up.
Twitter: @KimbleCharting
Any opinions expressed herein are solely those of the author, and do not in any way represent the views or opinions of any other person or entity.


