US Dollar Index “weekly” Chart – CURRENCY: USD
The US Dollar Index is flexing its muscle of late.
Trade wars and fear of a global slowdown have capital fleeing to King Dollar.
King dollar breakout test in play?
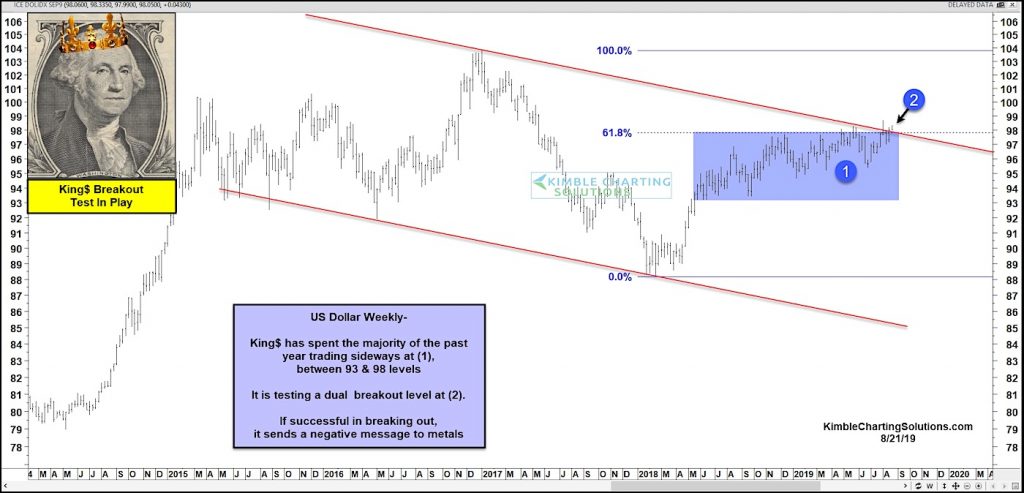
Looking at today’s chart, you can see that the Dollar has been consolidating in a range for the past year – see shaded area on chart (1).
Now King Dollar is attempting to breakout over the topside of that range at (2). That area represents dual resistance, as it also represents the 61.8 Fibonacci retracement level.
What it does here could highly impact the financial markets, including the precious metals. Stay tuned!
Note that KimbleCharting is offering a 2 week Free trial to See It Market readers. Just send me an email to services@kimblechartingsolutions.com for details to get set up.
Twitter: @KimbleCharting
Any opinions expressed herein are solely those of the author, and do not in any way represent the views or opinions of any other person or entity.


