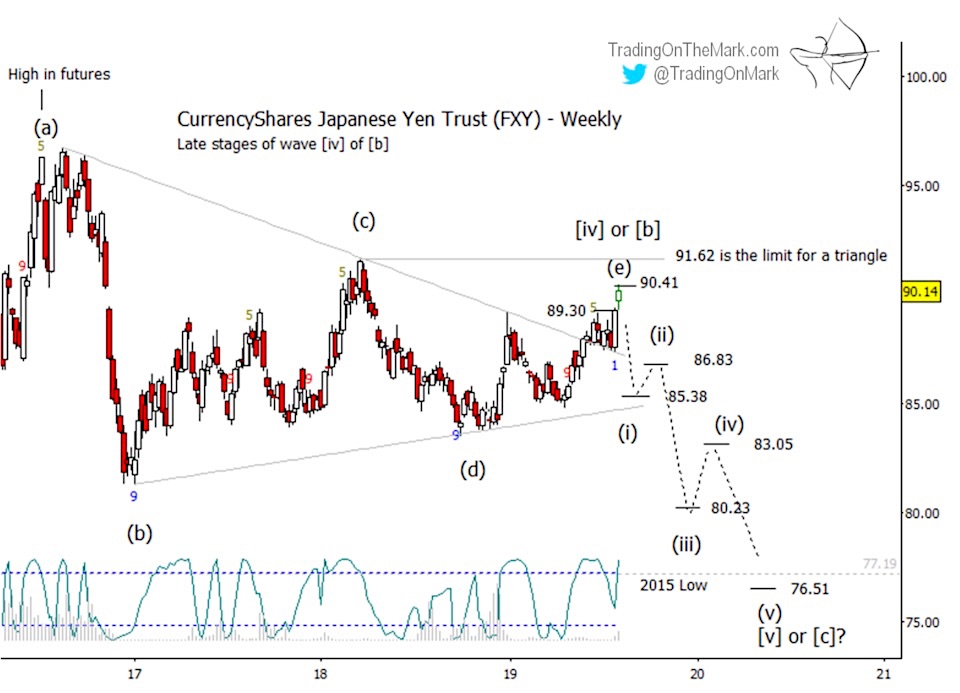
CurrencyShares Japanese Yen ETF NYSEARCA: FXY Elliott Wave Chart
This is a quick update for See It Market readers to show how the Japanese Yen ETF (FXY) is behaving within its contracting range.
A rejection of the spring/summer rally appears likely, and a reversal is possible.
Recall that we have been tracing the Japanese Yen currency as it has progressed through a multi-year Elliott wave triangle, and the triangle appears to be nearly complete.
The form counts well as being in the final stages of the final (e) wave. In fact, price recently tested the resistance we mentioned in last month’s article at 90.41.
The current placement of the Lomb periodogram on the weekly FXY chart favors either a pause in the rally or perhaps a reversal. This is corroborated by an analysis of cycles we have been monitoring on a futures chart (not shown here).
If a reversal takes hold soon, then the nearby resistance can serve the trader as a backstop. On the other hand, price would still be allowed to climb as far as 91.62 without violating the triangle pattern.
A failure of nearby support, previously resistance, at 89.30 and a weekly close beneath that level would act as initial confirmation of a reversal. If that takes place soon, then some very preliminary targets for a downward cascade include 86.83, 85.38, 83.05, 80.23, and 76.51. The latter area could be reached sometime in 2020 or 2021, and it would represent approximately a 15% decrease in value which is substantial for currency moves.
Keep on top of market moves with the free newsletter from Trading On The Mark and follow us on Twitter for timely alerts from an Elliott wave perspective.
Twitter: @TradingOnMark
The authors may have a position in the mentioned securities at the time of publication. Any opinions expressed herein are solely those of the author, and do not in any way represent the views or opinions of any other person or entity.


