The chatter around Gold – NYSEARCA: GLD – is growing as it trades above $1400/oz. Still, Gold bullish sentiment is nowhere near the fever pitch of 2010 / 2011.
The long breather / bear market of the past 8 years included a 40 percent decline and several fits and starts. This likely did a number on the “mom and pops”.
That said, Gold’s recent rise should set the stage for buyable pullbacks.
And the next pullback could begin in August.
In the charts below, we discuss why. As well, check out fellow contributor Samantha LaDuc’s recent article “Prepare for Pullback In Gold, Then Relaunch – Just Like 2008“.
With the Federal Reserve on tap, we could see a quick continuation move up to 1480 / 1500. So be sure to understand your timeframe, and trade accordingly.
Note that the following MarketSmith charts are built with Investors Business Daily’s product suite.
I am an Investors Business Daily (IBD) partner and promote the use of their products. The entire platform offers a good mix of technical and fundamental data and education.
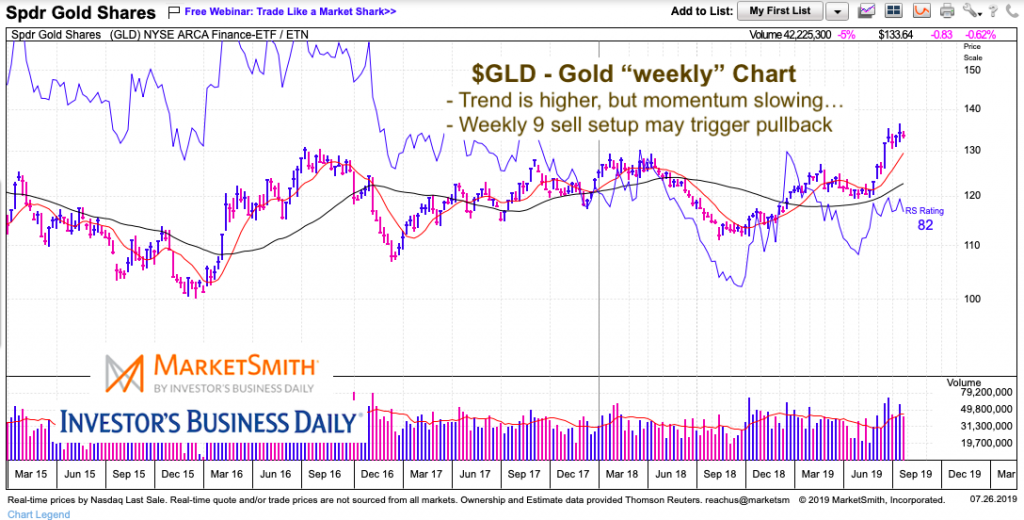
Gold “weekly” Chart
A divergence is brewing. As Gold makes new highs, momentum is slowing. Also, we have a TD 9 weekly sell setup and precious metals investors getting bulled up (near-term contrarian indicator).
The good news is that the 10 / 40 week moving averages are headed higher. This should contain any near-term pullback to 5 or 10 percent.
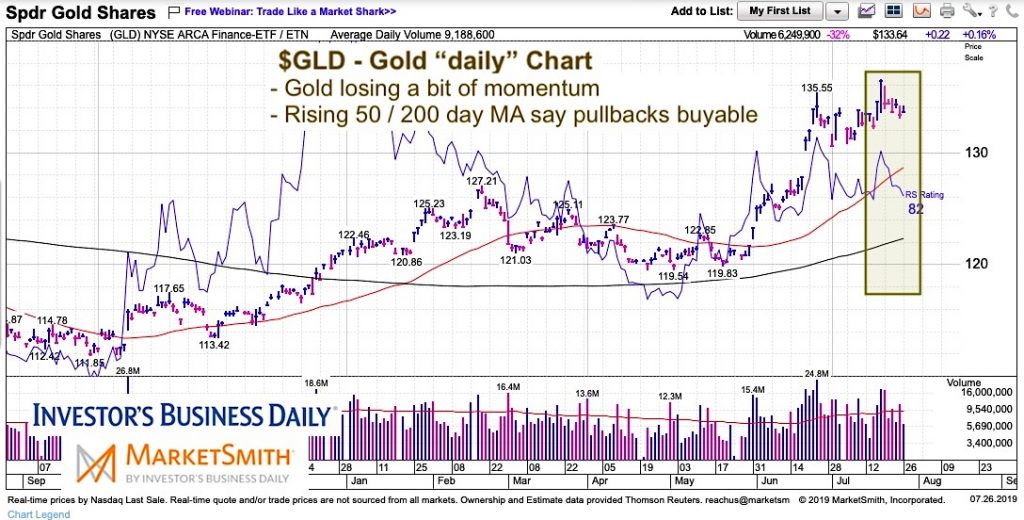
Gold “daily” Chart
Again, we see the slowing momentum and a bearish divergence. But, yet again, we see the rising 50 / 200 day moving averages as support.
Twitter: @andrewnyquist
The author may have a position in mentioned securities at the time of publication. Any opinions expressed herein are solely those of the author, and do not in any way represent the views or opinions of any other person or entity.

