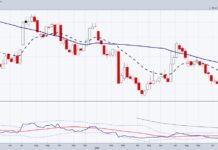
For the past decade, lumber prices have traded within a broad rising trend channel.
See (1) on the lumber “weekly” price chart below.
Recently lumber prices hit the bottom of that channel and began to bounce higher. This could be good news for the S&P 500 Index and stock market bulls.
The past two times that lumber prices bounced off the lower channel and broke out above its short-term declining trend line (2), it was a bullish signal for both Lumber and the S&P 500.
Lumber is testing its short-term declining trend line right now (3) and may send an important message to the S&P 500 once again.
Stock bulls hoping for a breakout at (3). Stay tuned!
Lumber Prices “weekly” Chart

Note that KimbleCharting is offering a 2 week Free trial to See It Market readers. Just send me an email to services@kimblechartingsolutions.com for details to get set up.
Twitter: @KimbleCharting
Any opinions expressed herein are solely those of the author, and do not in any way represent the views or opinions of any other person or entity.


