On Friday, April 26, 2019, the market was stunned with a much stronger than expected 3.2% rate of first-quarter economic growth. Wall Street expectations were clearly off the mark, ranging from 1.3-2.3%.
The media took this as a sign the economy is roaring. To wit, a headline from the Washington Post started “US Economy Feels Like the 1990s.”
Upon first seeing the GDP report, we immediately looked with suspicion at the surprisingly low GDP price deflator. The GDP price deflator is an inflation measure used to normalize GDP so that prior periods are comparable to each other without the effects of inflation.
The Bureau of Economic Analysis (BEA) reports nominal and real GDP. Real GDP is the closely followed number that is reported by the media and quoted by the Fed and politicians. Since the GDP price deflator is subtracted from the nominal GDP number, the larger the deflator, the smaller the difference between real and nominal GDP.
The following article was posted for RIA Pro subscribers on Monday. We share it with you to give you a flavor for the benefits of becoming an RIA Pro subscriber. Sign up today at RIA Pro and use our site for 30 days before being charged.
The BEA reported that the first quarter GDP price deflator was 0.9%, well below expectations of 1.7%. Had the deflator met expectations, the real GDP number would have been about 2.5%, still high but closer to the upper range of economists’ expectations.
Fueling the Deflator
Like Wall Street, we were expecting a deflator that was in line or possibly higher than its recent average. The average deflator over the last two years is 2.05%, and it is running slightly higher at 2.125% over the last four quarters.
Our expectation for an average or above average deflator in Q1 2019 were in large part driven by oil prices which rose by 32% over the entire first quarter. Due to the price move and the contribution of crude oil effects on inflation, oil prices should have had an unusually high impact on inflation measures in the first quarter of 2019.
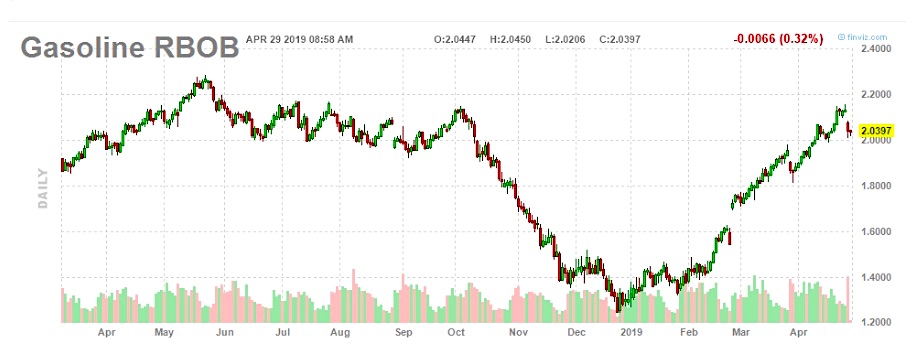
Per the American Automobile Association (AAA), gas prices in the United States rose from $2.25/gallon in January to $2.75 by the end of March, a gain of 22%. Gasoline RBOB futures, the most commonly quoted contract for wholesale gasoline prices, tell a similar story, rising from $1.30/gallon to $1.83/gallon over the quarter, for a gain of 41%.
With a good amount of digging through the BEA website, we learned that despite the substantial rise in the price of oil and gasoline in the first quarter, the BEA actually reported a decline in fuel prices.
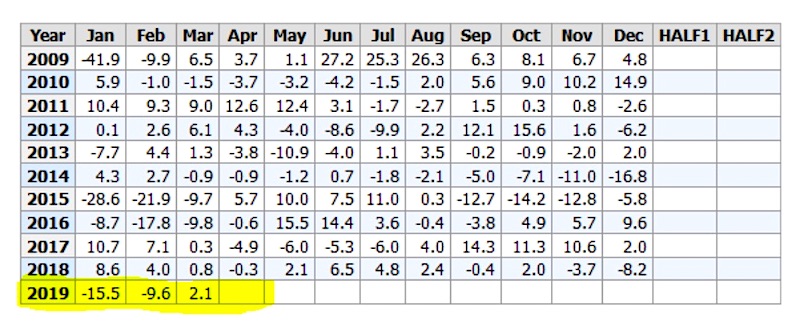
The BEA, which uses data from the Bureau of Labor Statistics (BLS) Consumer Price Index (CPI) report, reported that fuel prices fell on average by 7.8% during the quarter. The table below for fuel prices (BLS code CUSR0000SETB) from the BLS is the direct input used to account for energy prices within the GDP deflator.

The BLS is not wrong; they are just using a three-month average, and therefore their data lags by three months. Essentially, the fuel price data feeding the first quarter GDP deflator is from the fourth quarter of 2018. During this period, the price of oil and gas fell precipitously.
With a little back of the envelope math, we conclude that had the price of oil been unchanged the deflator would have been approximately 1.45%, and Real GDP growth would have been 2.75%.
Had the price risen, instead of fallen, by 7.8% the deflator would have been 1.99%, and GDP would have been 2.20% and on par with expectations. Had it risen more than 7.8%, Real GDP would have been even lower.
Implications
The BEA is not cooking the books. However, by this methodology using old data, sharp changes in fuel prices will result in flawed quarterly data. This problem is self-correcting. For instance, the sharp decline in oil prices in the fourth quarter which helped lower the deflator in the first quarter will be offset when the surge in first quarter oil prices weigh on second-quarter GDP. The graph below shows Gasoline RBOB futures to highlight the recent volatility in gasoline prices.

It is not just the deflator that concerns us about second-quarter GDP. In this weekend’s newsletter, The Bull Is Back… But Will It Stay?we stated the following:
“Almost 50% of the increase in GDP came from slower imports and a massive surge in inventories which suggests slower consumer consumption which comprises roughly 70% of economic growth.
In other words, future GDP reports will also likely be weaker. (Net Trade and Inventories was 1.68% of the 3.2% rise.)”
The ratio of inventory to sales has steadily climbed over the last 12 months. If consumption stays weak, we should see companies backing off on inventory stocking. Rising inventories increase GDP and falling inventories have the opposite effect. As a result and as stated above “future GDP reports will also likely be weaker.”
Looking ahead, we are confident that the second quarter GDP deflator will be 2% or higher. We also believe that if consumption remains frail, companies will slow their inventory growth. While difficult to predict as we are only a month into the quarter, these two important factors are likely to weigh on second-quarter GDP. Keep in mind, these are only two of thousands of factors, but they play an outsized role in determining GDP.
Currently, and subject to change as more economic data is released, we have a strong suspicion that the positive surprise in the Q1 report will be followed with an equally surprising weak Q2 report. As stock markets probe new record highs, the question for investors is, will the market care?
Twitter: @michaellebowitz
Any opinions expressed herein are solely those of the author, and do not in any way represent the views or opinions of any other person or entity.


