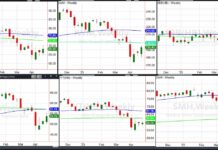
If a picture of the Russell 2000 (IWM) says 2000 words, then Monday’s potential stock market topping pattern could say a lot more.
See the levels below and follow me on Twitter (@marketminute) for more updates (and see my daily post this evening).
I’m having computer issues, but here are the levels to watch across the major stock market index and sector ETFs.
Good luck out there!
S&P 500 ETF (SPY)
280.40 the last December swing high before the crash. With the close below, possible top is in. 276.00 is next the important support to hold on a closing basis
Russell 2000 ETF (IWM)

November 8thhigh 157.90 is now pivotal. It’s also where the 200-DMA is. Since it managed to close above, 157.90 pivotal for Monday on a closing basis.
Dow Jones Industrials ETF (DIA)
260.30 was the last swing high before the crash. Friday high 260.40. If closes below tomorrow-weak. Then support at 258.70 and 256.25.
Nasdaq 100 ETF (QQQ)
172.10 the 200-DMA pivotal. Nasty reversal patterns in all indices if we get another day of weakness to confirm that.
Twitter: @marketminute
The authors may have a position in the mentioned securities at the time of publication. Any opinions expressed herein are solely those of the author, and do not in any way represent the views or opinions of any other person or entity.


