JANUARY CLOSE PROVIDES INSIGHT
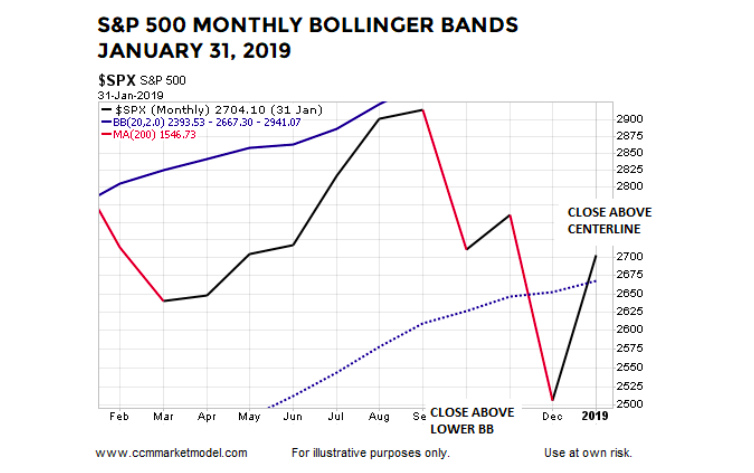
The chart below shows the S&P 500 closed above the monthly Bollinger Band centerline (a.k.a. center band) on January 31, 2019. The January print occurred after the S&P 500 closed below the centerline in December, but above the lower Bollinger Band.
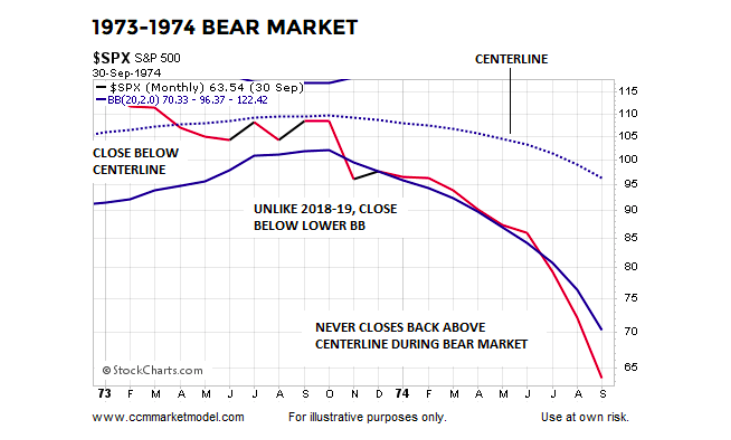
1973-74 BEAR MARKET
As shown in the 1973-74 version of the same chart, notice how the S&P 500 was unable to recapture and close above the Bollinger Band centerline during the entire bear market. Unlike the 2019 case (thus far), the S&P 500 closed below the lower Bollinger Band in November 1973.
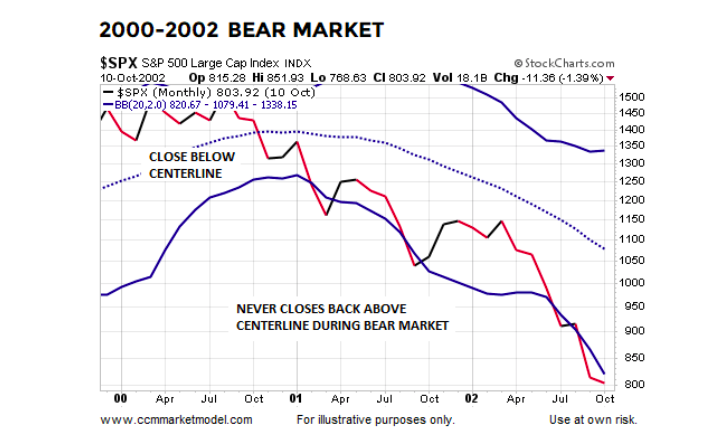
DOT-COM BEAR MARKET
The same can be said for the 2000-02 bear market; the S&P 500 never closed back above the Bollinger Band centerline after closing below it in Q4 2000. As shown below, really bad things happened after Q4 2000. Unlike the 2019 case, the S&P 500 closed below the lower Bollinger Band in February 2001.
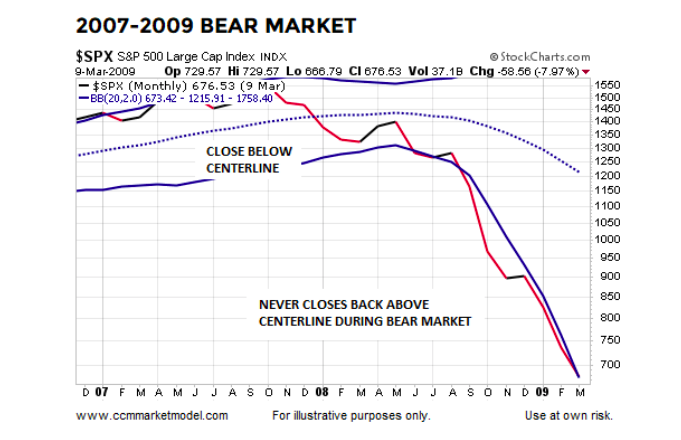
FINANCIAL CRISIS BEAR MARKET
After stocks peaked in October 2007, the S&P 500 closed below the monthly Bollinger Band centerline in January 2008 and never closed back above it during the painful bear market. Unlike the 2019 case, the S&P 500 closed below the lower Bollinger Band in June 2008.
2019 LOOK IS RARE
It is relatively rare for the S&P 500 to move from above the monthly Bollinger Band centerline, close below the centerline while remaining above the lower Bollinger Band, and subsequently print a monthly close back above the centerline, which is what just happened in 2018-2019.
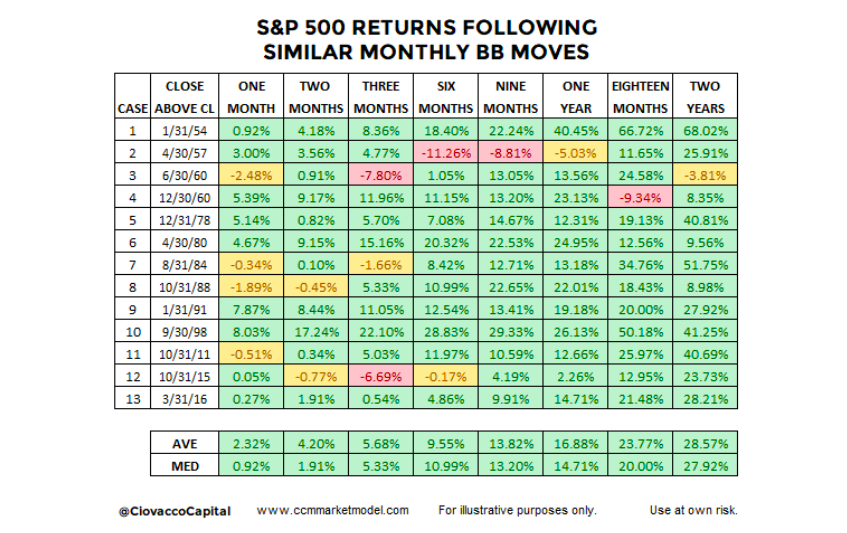
Dating back to 1950, there were thirteen similar looks that appeared on the S&P 500’s monthly chart. As shown in the table below, the bias for stocks over the next two years was favorable.
CASES WITH BREADTH THRUSTS
The monthly Bollinger Band setup described above is rare. It is interesting to note that two of the Bollinger band cases, 1954 and 1991, basically coincided with an extremely rare 10-day breadth thrust that was covered on January 21, 2019. Therefore, we have three cases that feature both the Bollinger Band setup and rare breadth thrust: 1954, 1991, and 2019.
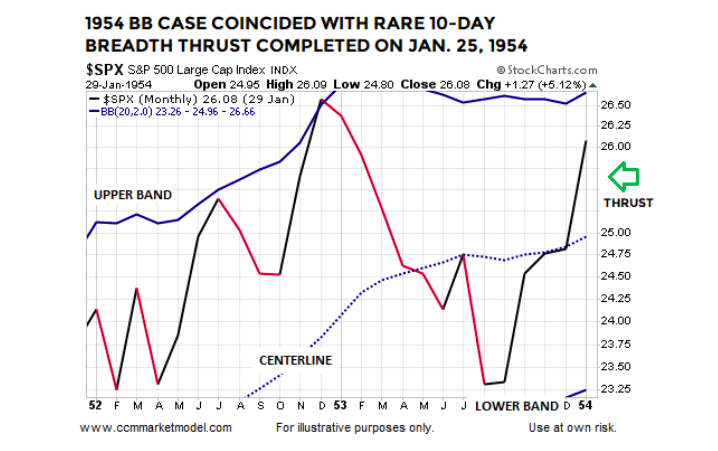
The look of the monthly chart on the last trading day of January 1954 is similar to the rare look found at the end of January 2019.
The ten-day breadth thrust was completed on January 25, 1954, four trading days before the monthly Bollinger Band setup went into the books.
continue reading this article on the next page…

