Instructions for sloshing for gold include not to get distracted by so-called fool’s gold.
That’s the glittery stuff like iron pyrite and silicate materials.
The instructions also suggest that one should go out to slosh after a storm.
As Gold is more than 19 times heavier than water, it’s not as hard to find as one might think.
In trading gold (NYSEARCA: GLD) on the financial markets, there are similarities.
It seems to be the best investment during or after storms.
It can be well worth its weight, well in gold, then in equities.
How then, might we trade gold without the distraction of fool’s gold?
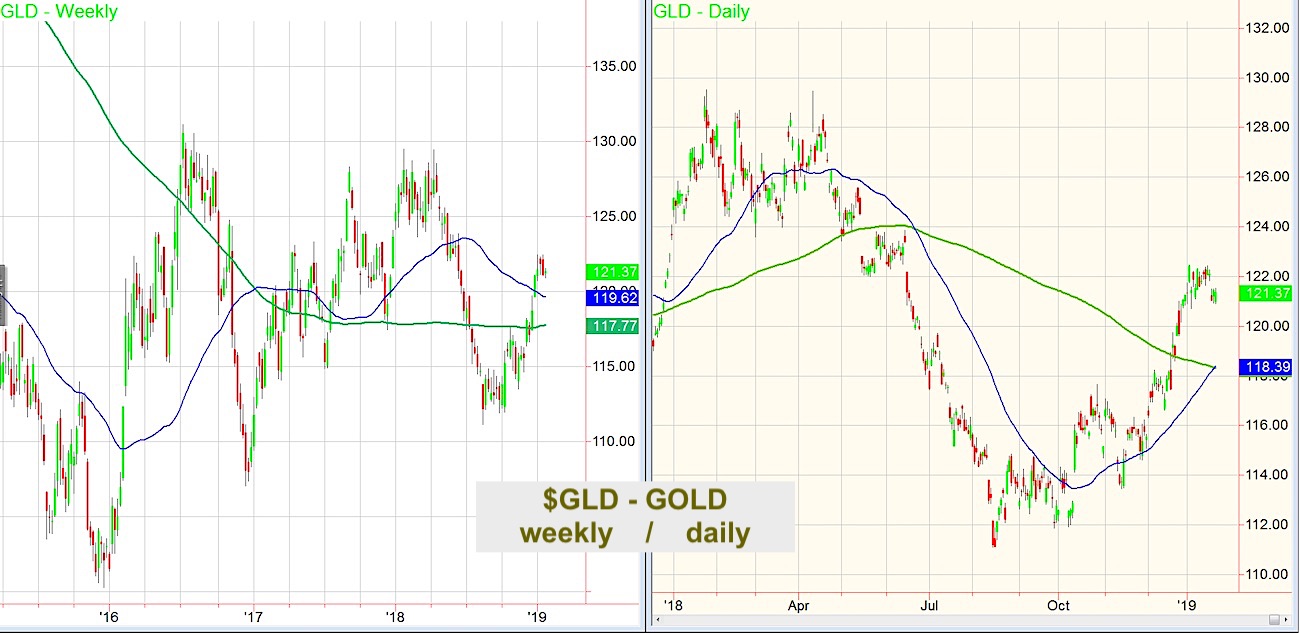
On the left is the weekly chart, the right the daily.
Both timeframes show the metal over key moving averages.
Today, GLD the ETF, entered into a bullish cross (when the 50 blue, crosses over the 200 green.)
Since 2016, gold has made higher lows on corrections.
Since 2018, gold has formed a base over 118.50.
Since 2019 began, gold has held 120.
The last swing high was 122.46.
Should the onslaught of potential daily storms that negatively impact the market continue, then keep your eyes on the heavy metal.
The way to avoid buying fool’s gold?
About 2½ tons of rock must be processed to yield an ounce of gold.
Some patience should help you see the difference between an ordinary shiny rock and the illustrious yield.
S&P 500 (SPY) – Still holding in a Recuperation phase as long as it closes above 261.74. A V-bottom can easily transform into a bear flag if that level fails.
Russell 2000 (IWM) – Still holding in a Recuperation phase as long as it closes above 143.46. Unless this closes the week over 147.20, we could see more weakness.
Dow Jones Industrials (DIA) – IBM helped this today. 242.85 is its 50-DMA to hold.
Nasdaq (QQQ) – 161.23 the 50-DMA. 164.24 the area to close above this week to keep the bulls happy
KRE (Regional Banks) – 52.96 pivotal for the end of this week
SMH (Semiconductors) – Back to a confirmed bear phase. 88.50 the big support
IYT (Transportation) – Confirmed bearish phase. 177.47 the 50 DMA and 180 huge weekly resistance. Under today’s lows, 170 is next support
IBB (Biotechnology) – 110 resistance with 106.40 some support and 103.55 underlying support
XRT (Retail) – 43.75 pivotal. 44.75 the overhead weekly resistance.
Twitter: @marketminute
The authors may have a position in the mentioned securities at the time of publication. Any opinions expressed herein are solely those of the author, and do not in any way represent the views or opinions of any other person or entity.


