Yes, the market had a soft landing on support with decent follow through today.
With better than average volume, bulls will surmise that this is a bottom.
And since price pays, with the last 2 days action, technically, we can say that for now, the worst could be over.
Yet, examining our triage of macro factors, what has really changed in the last 3 weeks?
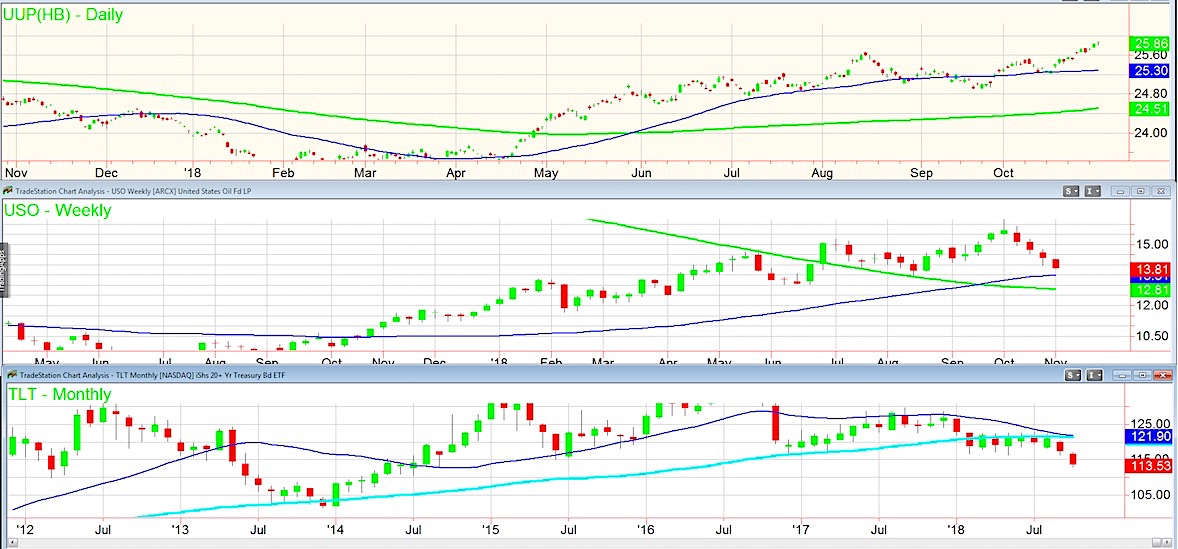
The U.S. Dollar (Daily chart), which I featured 2 days ago, gained in strength. See chart in image below.
The US Dollar ETF (NYSEARCA: UUP) is close to resistance at 25.93.
That was the last high in 2017 before the major downfall.
The 20+ Year Treasury Bond ETF (NASDAQ: TLT) lost ground today and look like the price could be heading closer to 110. Hence, rates firmed further. See “monthly” chart in image below.
The US Oil Fund ETF (NYSEARCA: USO) fell. See “weekly” chart in image below.
However, the 50-week moving average it traded below until October 2017, remains intact. In fact, this is the first test of that breakout in a year.
That will be a key retest of the 50-week MA. We imagine that level will hold, thus keeping the uptrend in place.
So, other than a dip in oil prices, what has changed?
The villian that many blamed for the correction-higher rates-just got more villianous.
Unless the rates take a tumble and why should they, to my mind that spells that this is a tradeable bounce that could be short-lived.
S&P 500 (SPY) – 270.25 will be pivotal for Thursday.
Russell 2000 (IWM) – I did not find this action that great considering it could not close over 150.67. New month. Keep in mind the 23-month MA at 149.67
Dow Jones Industrials (DIA) – It held 250.24 which is the pivotal number for Thursday.
Nasdaq (QQQ) – Could not close above the outside day candle-I take this as a sign of weakness.
KRE (Regional Banks) – It did gap above 53.69. Best hope for more rally if that level holds, especially if it clears 55.
SMH (Semiconductors) – Managed to close right on the 23-month MA at 93.76. First key area to clear and 90 best underlying support.
IYT (Transportation) – Held 182.67. And still has work to do-like hold 180.81 its 23-month moving average.
IBB (Biotechnology) – Below the 200 week and 23-month MA right now.
XRT (Retail) – Failed 47.25 the 50-week MA. And closed below the 200 DMA. Like to see this take those areas back and close over 47.80 before getting excited.
Twitter: @marketminute
The authors may have a position in the mentioned securities at the time of publication. Any opinions expressed herein are solely those of the author, and do not in any way represent the views or opinions of any other person or entity.


