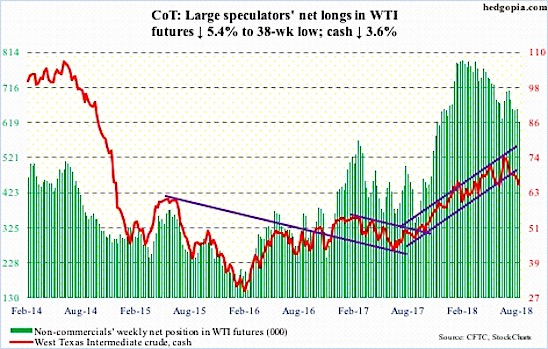
The chart and data that follow highlight non-commercial commodity futures trading positions as of August 14, 2018. This data was released with the August 17, 2018 COT Report (Commitment of Traders).
Note that this chart also appeared on my blog.
The chart below looks at non-commercial futures trading positions for WTI Crude Oil futures. For the week, the spot Crude Oil finished down -3.6%, while the United State Oil ETF (NYSEARCA: USO) closed down -2.8%.
Here’s a look at WTI Crude Oil futures speculative positioning. Scroll further down for commentary and analysis.
Crude Oil has struggled to firm up due to continued US Dollar strength. But it’s oversold and the 200 day moving average is holding as support.
Let’s look at the COT data and technical to see what’s next…
Crude Oil: Currently net long 621.6k, down 35.2k.
A couple weeks back, spot WTI crude oil slightly broke below a rising trend line from June 2017 This past week, the underside of that trend line thwarted rallies (resistance). Crude also lost support around $67 and tested the 200-day moving average (its first test since last October). It’s holding thus far.
As well, Crude oil is oversold near-term – so there’s room for a rally, perhaps up to resistance at $69-69.50. Bears will be watching. Note the rising trend line support from February 2016 which lies around $56. That was when WTI bottomed at $26.05.
Twitter: @hedgopia
Author may hold a position in mentioned securities at the time of publication. Any opinions expressed herein are solely those of the author, and do not in any way represent the views or opinions of any other person or entity.


