The performance of the equity markets has been troublesome.
The S&P 500 Index (INDEXCBOE:.INX) and the Dow Jones Industrials (INDEXDJX: .DJI) posted solid gains last week but the NASDAQ (INDEXNASDAQ:.IXIC) fell 1.0% and the Russell 2000 (INDEXRUSSELL:RUT) small-cap index dropped almost 2.0%.
And this week has seen more selling.
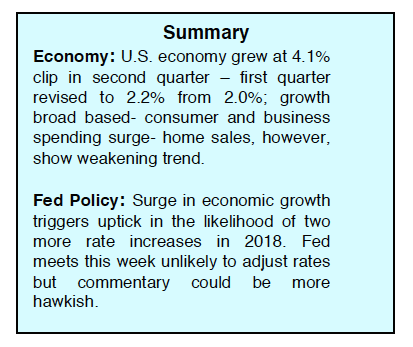
Economic statistics confirmed that the economy is healthy. GDP rose to 4.1% in the second quarter, consumer spending rose 4.0% compared to an average of 2.4% over the past four quarters.
Additionally, 83% of S&P 500 companies have reported a positive earnings per share surprise, according to FactSet, and is the highest percentage since FactSet began tracking this metric in 2005. The latest economic numbers show that business expansion is becoming more widespread with capital spending added into the mix for the first time in nearly a decade.
The fact that the good news on the economy failed to lift all boats suggests the stock market is likely to remain in a trading range over the near term.
Offsetting the positive business data is the ongoing trade and tariff confrontations and a rising interest rate environment. The focus this week will be on the Federal Reserve meeting on Tuesday and Wednesday for hints of monetary policy going forward in light of the latest data on the economy. The Fed is widely anticipated to raise the fed funds level 25-basis points in September. This would mark the eighth time in a row the Fed has increased short-term rates since late 2015.
This week also offers an important test of the market’s underlying strength with another surge of earnings reports, including the much-anticipated numbers from Apple (AAPL) on Tuesday.
The technical underpinnings of the stock market are little changed the past two weeks. Under the surface, the broad market continues to lag the averages suggesting a continuation of a trading range environment. There has yet to be a session where upside volume overwhelms downside momentum and for the third week in a row there has been virtually no progress in the number of advances versus declining issues.
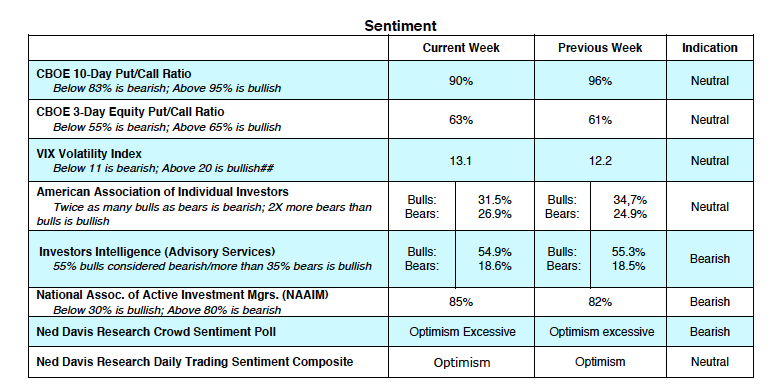
The lack of breadth is particularly pervasive at the NASDAQ where, despite new record highs, only 53% of the issues traded are above their 200-day moving average. Evidence of breadth deterioration can also be seen in large-cap indices. Despite new cycle highs by the S&P 500 Index, the percentage of groups within the index has reversed to the downside. Measures of investor sentiment show that optimism continues to creep in as seen in the Ned Davis Daily Trading Sentiment Composite that is close to entering the extreme optimism zone. From a contrarian’s perspective, this has negative implications for stocks over the near term. Although seasonal trends play a small role in valuing risk/reward parameters, the fact that stocks are entering the weakest two months of the year (August and September) cannot be ignored.
Historically, seasonal headwinds are the strongest in mid-term election years. Overall the technical picture is likely to remain clouded until late in the year when stocks typically turn up in November and December.
Twitter: @WillieDelwiche
Any opinions expressed herein are solely those of the author, and do not in any way represent the views or opinions of any other person or entity.


