It may be time for traders to give Platinum a second look.
After a steep decline, Platinum may be forming a trading bottom.
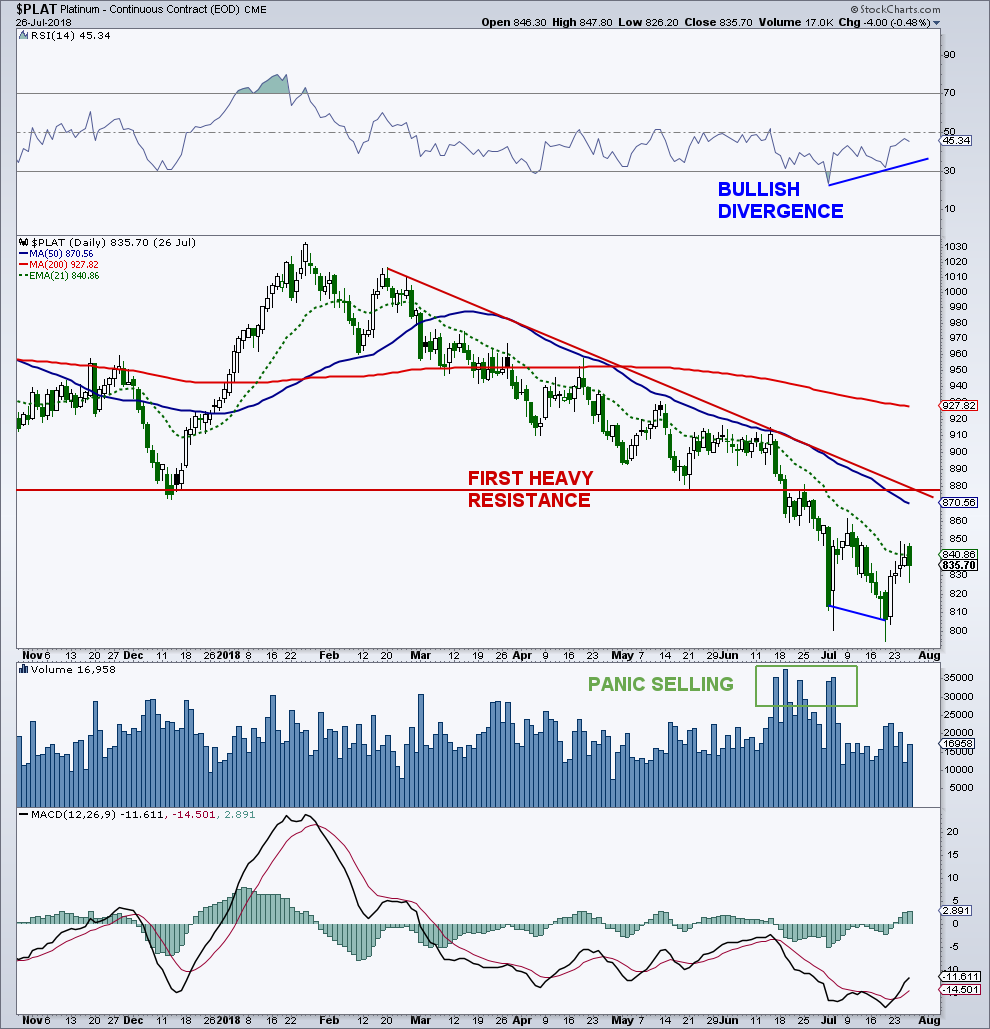
Looking at the chart below, it appears that Platinum is tracing out a double bottom or inverse head-and-shoulders bottom. And there is little technical resistance until the $880 area.
There was a bullish momentum divergence at the latest closing low with a nice decrease in volume. Extremely heavy volume was seen in June and early July, after a major decline, and looks to be capitulatory in nature.
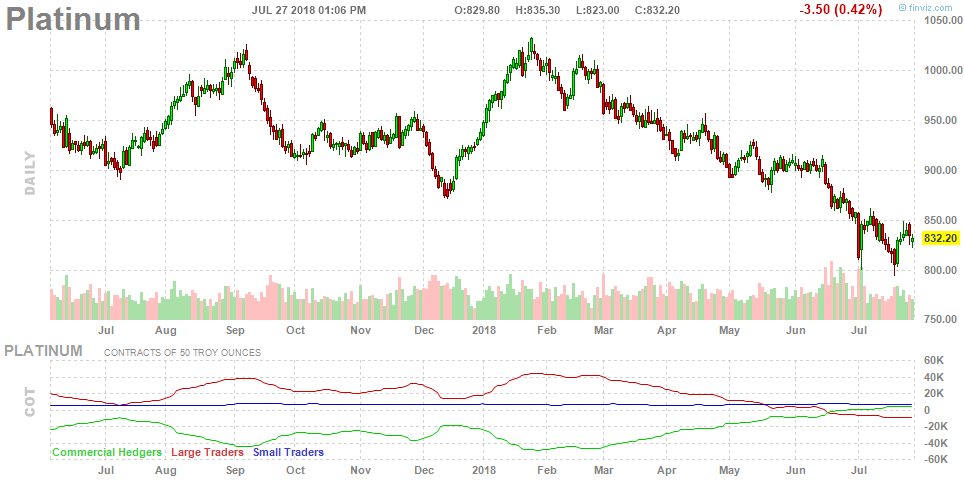
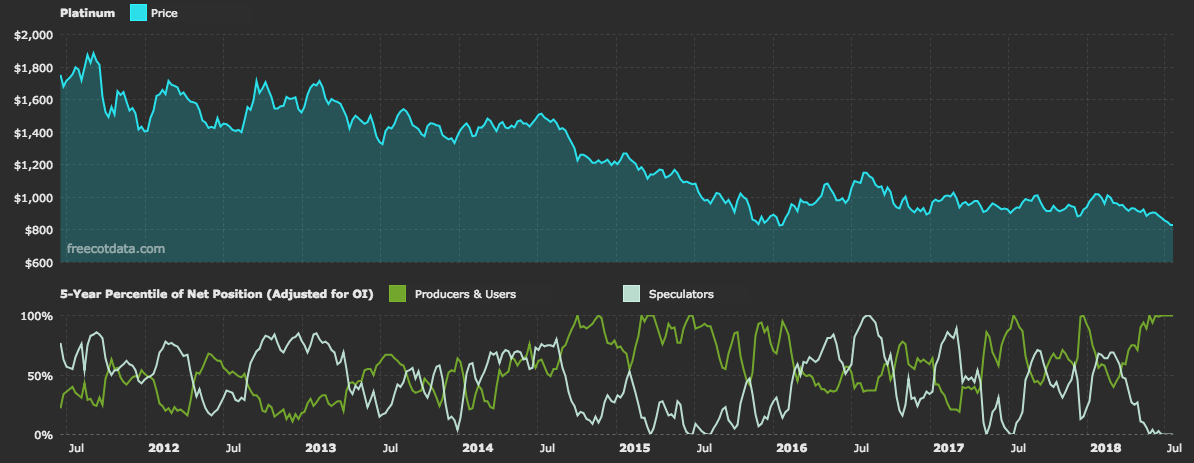
In addition, commercial hedgers have an extremely bullish position in platinum when adjusting for open interest (OI) while large speculators (not so smart money) have a very small position (OI adjusted) in the metal.
See chart below.
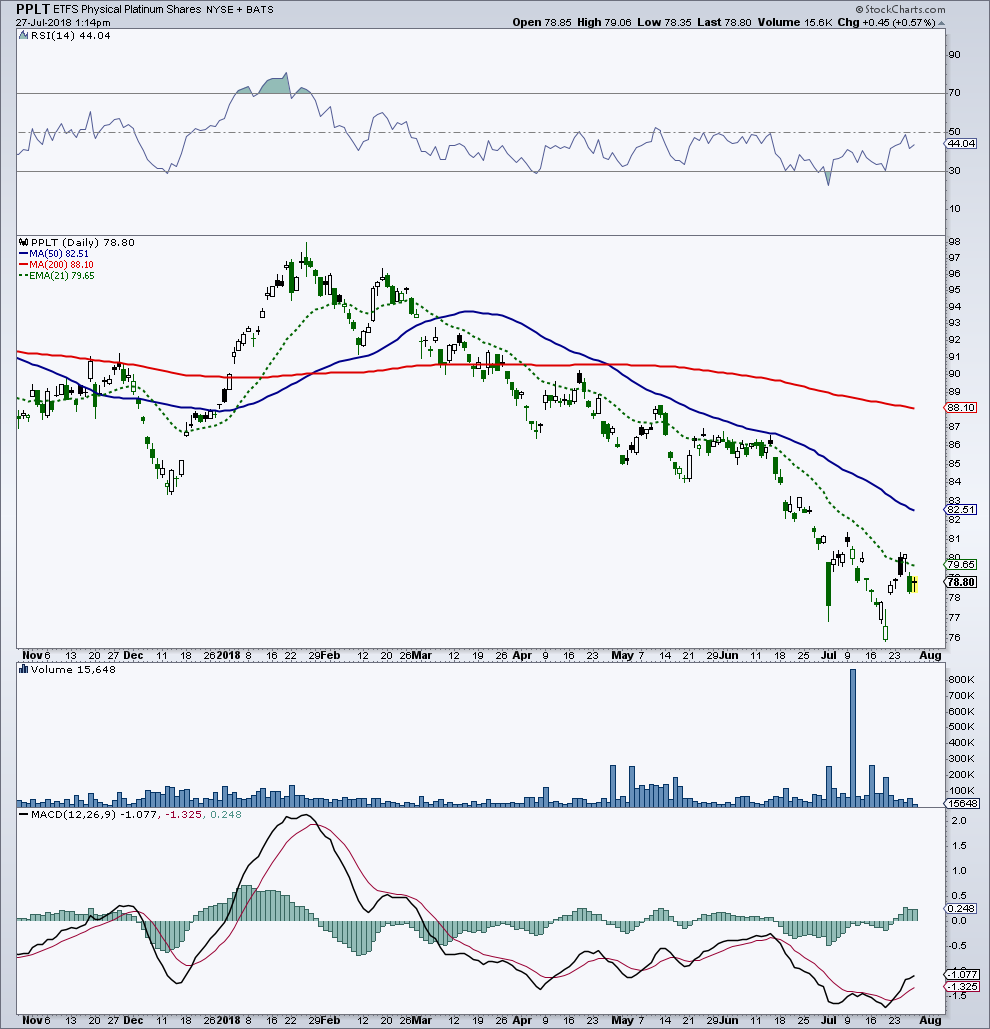
One way to play platinum, other than the futures market, is with the ETFS Physical Platinum Shares, symbol PPLT (see chart below). Note that I have a small position in PPLT.
Platinum ETF (PPLT) CHART
COT DATA: Certainly favorable for a bottom with commercials having a larger net position in platinum futures than large speculators for the first time in over a decade.
COT DATA COURTESY OF WWW.FREECOTDATA.COM – This COT data is adjusted of open interest and can reveal vast differences vs. using just the net data. This shows that commercials (smart money) have a large platinum position (looking back 5 years) while speculators (not so smart money) have a tiny platinum position. Like everything, this method is not correct all the time, but certainly adds to the analysis.
Feel free to reach out to me at arbetermark@gmail.com for inquiries about my newsletter “On The Mark”. Thanks for reading.
Twitter: @MarkArbeter
The author has a long position in Platinum at the time of publication. Any opinions expressed herein are solely those of the author, and do not in any way represent the views or opinions of any other person or entity.


