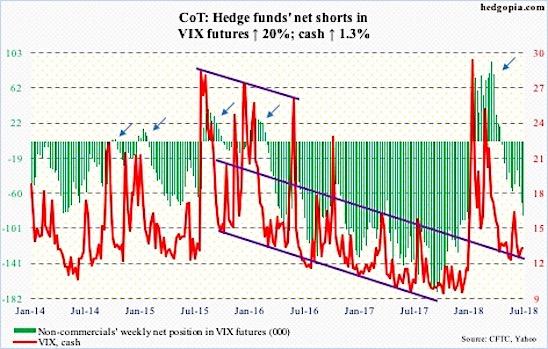
The chart and data that follow highlight non-commercial commodity futures trading positions as of July 24, 2018.
This data was released with the July 27 COT Report (Commitment of Traders). Note that this chart also appeared on my blog.
The chart below looks at non-commercial futures trading positions for VIX Volatility Index futures. For the week, the VIX spot price (INDEXCBOE:VIX) perked up, finishing over 13.
Here’s a look at VIX Volatility Index futures speculative positioning. Scroll further down for commentary and analysis.
The VIX Volatility Index is holding its own right here and may be looking at the beginnings of a trend change.
Let’s look at the COT data and technical to see what’s next…
VIX Volatility Index Futures: Currently net short 86.2k, up 14.3k.:
For over seven weeks, volatility bears tried to push the cash index under 11, but unsuccessfully. Unlike in the past when the VIX routinely dropped to 10 – even high single digits (all-time low of 8.56 last November) – it has found support at a higher level since stocks sold off late January-early February. Unless broken, this is a trend shift. The only thing is, attempts to push off of this support have met selling, with 19-plus resisting rally attempts several times the past three months. Friday, the VIX Volatility Index was unable to take out the 200-day. But in all probability a breakout is coming.
In the meantime, the 21-day moving average of the CBOE equity-only put-to-call ratio continued to inch higher, with Friday at 0.623. This metric has thus far diverged from the S&P 500. On June 26, it dropped to 0.56, which is low and reflects built-in optimism. One reason behind this is that protection is being sought even as stocks are rallying. Put skew is positive, and elevated.
Twitter: @hedgopia
Author may hold a position in mentioned securities at the time of publication. Any opinions expressed herein are solely those of the author, and do not in any way represent the views or opinions of any other person or entity.


