In an article earlier today, Mark Newton referred to the stock market as “disjointed”.
I kinda like that.
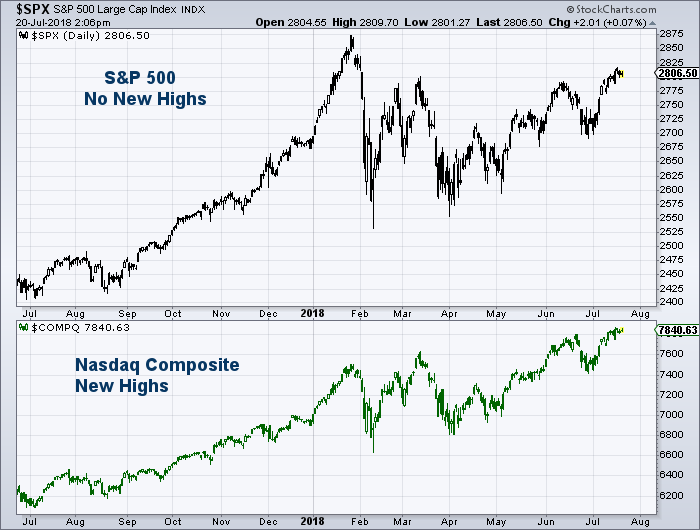
While Tech stocks (NASDAQ: QQQ) and Small Cap stocks (NYSEARCA: IWM) have been running, the “broader” S&P 500 (NYSEARCA: SPY) and Dow Jones Industrials have been jogging. The former two have made new all-time highs, will the latter two have not.
This price divergence is worrisome… at least from a near-term perspective.
As well, both Tech (Nasdaq 100) and Small caps (Russell 2000) are showing RSI divergences on their daily, weekly, and monthly charts. Divergences can go on for a while, but the daily/weekly should give way to a pullback sooner than later in my opinion.
Crude oil and the Energy sector have also pulled back over 10 percent. Will stocks follow suit?
In short, the evidence makes me believe that the broader market is NOT ready to break out.
At the same time, trimming positions and/or looking for a pullback is NOT the same as calling for a crash.
Like Mark Newton, I’m looking for a near-term pullback to begin some time next week. The S&P 500 reach up to 2830 if it wants to go a bit higher. The Nasdaq 100 is within a few percent of the upside Elliott Wave trading targets shared by Trading On The Mark.
High level recap of past 2 months:
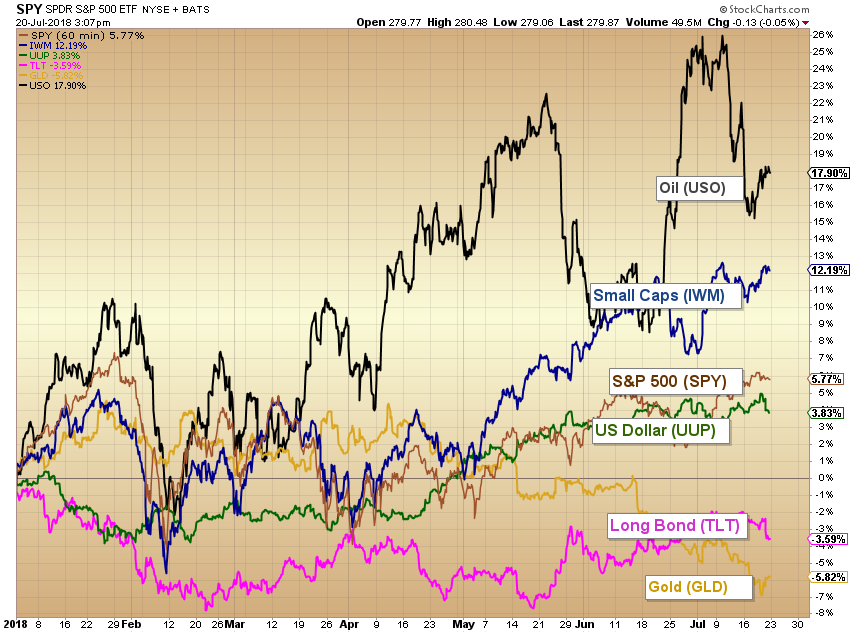
Small Caps and Tech strong. Transportation stocks rebounding (Michele Schneider highlighted Small Caps and Transports here yesterday). US Dollar holding up. Energy and crude pulling back. Natural Gas and precious metals lower.
This macro information helps us understand the market and relationships. But it doesn’t tell us what to expect over the next week or month.
So What’s Next?
I believe we are nearing a selloff. Better said, the risk/reward isn’t great across the major market indices. I think getting defensive is a good idea over the coming weeks. I expect the S&P 500 and Dow Jones to continue to trade rangebound, which means a move lower will take shape as this rally comes to an end.
Again, just my research speaking here.
Inside my head…
I am a trader. Therefore, my time frame is short- to intermediate-term. I often mention macro themes for context but I try to discuss the next week to month or two.
I am not short… yet. My longs represent about 35 percent of my portfolio. The rest is cash.
I’m not into calling for crashes… especially before the market turns lower. I simply follow the price action.
Stock Market Indicators… And Bad Breadth
Here’s a chart from Willie Delwiche that appeared in his weekly outlook. Nasdaq market breadth is not nearly as healthy as the price action. And it’s overbought
NEW Article: “U.S. Equities Weekly Outlook: Momentum & Breadth Unconvincing” – https://t.co/bkhp3tNvcJ by @WillieDelwiche$SPY $QQQ $TNX pic.twitter.com/KLmQ8EafBM
— See It Market (@seeitmarket) July 20, 2018
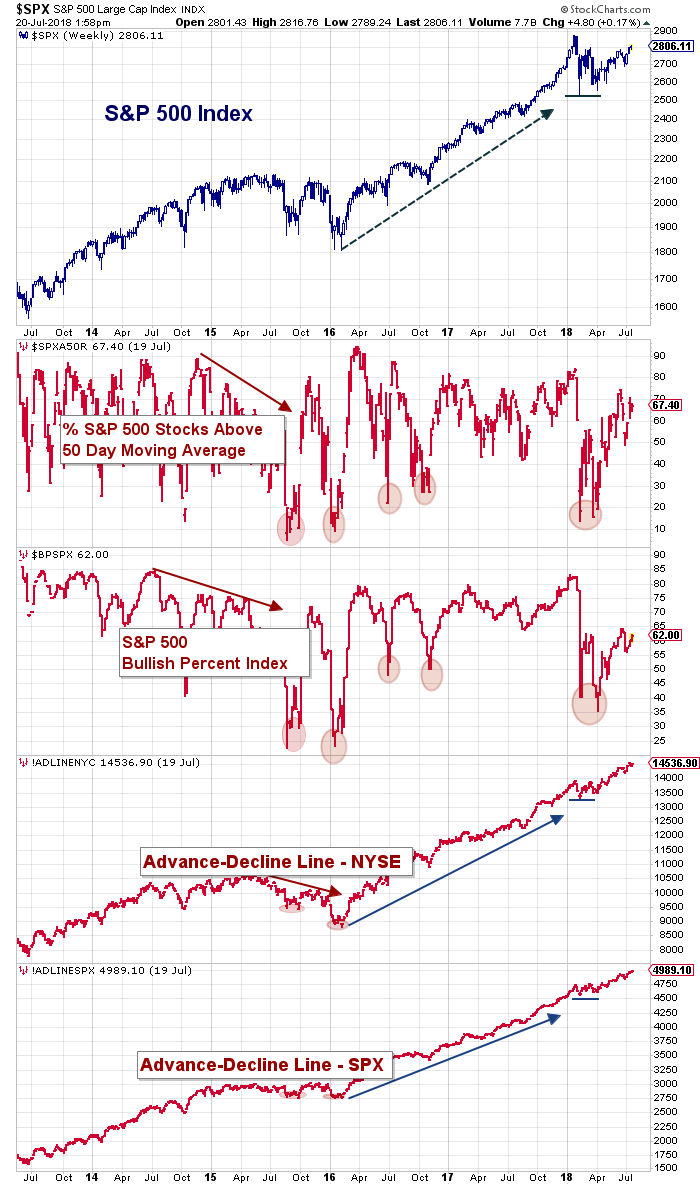
Here’s a similar look at the S&P 500 and NYSE market breadth. Same thing, however, I will say that the Advance Decline line is still strong.
One last look across the Sector ETFs (2018 YTD):
Stocks continue to be in favor on a broader view, with energy, small caps and tech leading the way. Bonds and Gold have taken a beating. BUT, perhaps we’ll see bonds perk up in the coming weeks… of course dependent on how any pullback takes shape.
More to come. Thanks for reading and good luck out there.
Twitter: @andrewnyquist
Any opinions expressed herein are solely those of the author, and do not in any way represent the views or opinions of any other person or entity.


