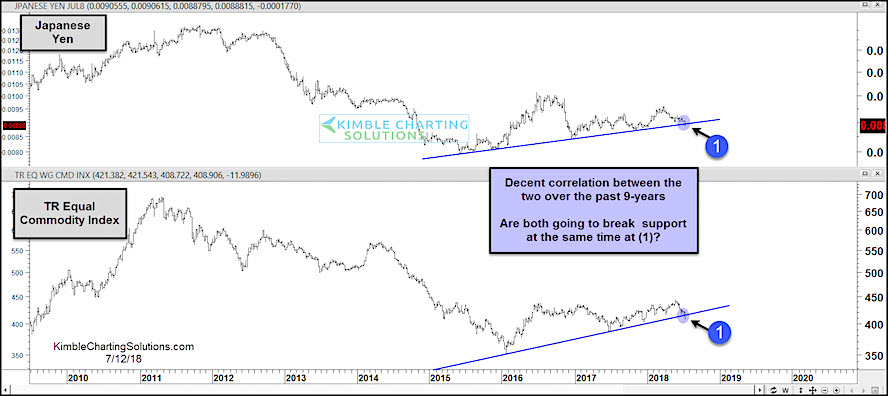
Over the past 9 years, the Japanese Yen (NYSEARCA:FXY) and Commodities have followed one another higher and lower.
The correlation can be found in the chart below, using the Thomson Reuters Commodity Index.
Both found a bottom in late 2015 / early 2016 and rallied since.
But that trend line could be in danger…
The Japanese Yen is turning lower along with the Commodity Index. As you can see in the chart below, each one is testing uptrend support (at point 1).
Grains, Metals, and Natural Gas have been struggling and need some buyers to step in. If support breaks, it could mean a broader pullback for the commodities sector.
Japanese Yen vs Commodities Index
Note that KimbleCharting is offering a 30 day Free trial to See It Market readers. Just send me an email to services@kimblechartingsolutions.com for details to get set up.
Twitter: @KimbleCharting
Any opinions expressed herein are solely those of the author, and do not in any way represent the views or opinions of any other person or entity.


