Broad Stock Market Trading Overview for June 27, 2018
S&P 500 futures are holding recent lows but need to see some follow through to the upside, if traders wish for a legitimate bounce.
Upside resistance will be difficult to surmount. But traders will want to eye resistance levels for failures or breakout retests. Deep support around 2700 is important. If this level fails to hold, then we’ll fall to deeper support.
S&P 500 Futures
Yesterday’s lows broke overnight but have since recovered in another weak bounce. From an intraday perspective, we are still hunting for deeper support but if we can hold above 2700, buyers may be emboldened to try to move us above the critical level of 2727. Until we get over the breach of resistance and present higher lows this morning, buyers won’t be inclined to participate.
The bullets below represent the likely shift of trading momentum at the successful or failed retests at the levels noted.
- Buying pressure intraday will likely strengthen with a bullish retest of 2727.75
- Selling pressure intraday will likely strengthen with a bearish retest of 2714.75
- Resistance sits near 2724.5 to 2732.5, with 2739.25 and 2754.25 above that.
- Support sits between 2709.5 and 2701.5, with 2697.25 and 2687.75
NASDAQ Futures
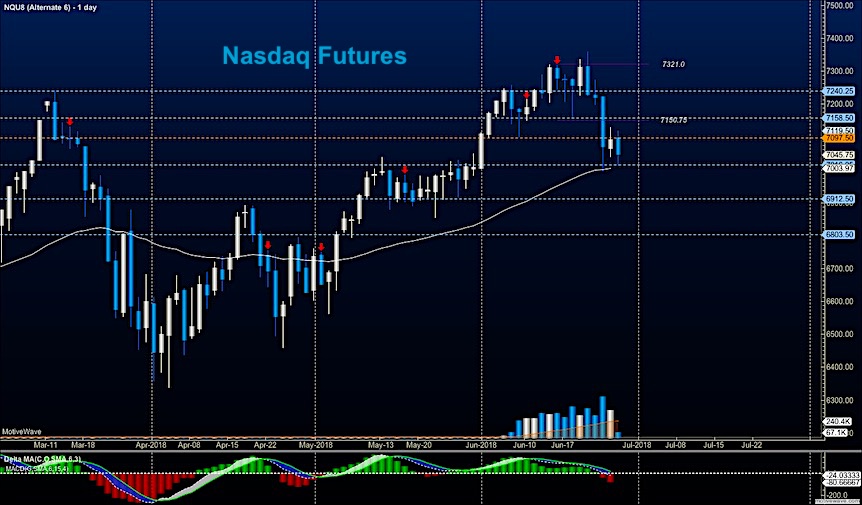
Traders here pressed lower but returned in force. The current bounce action forced us into and above 7097.5 but buyers have been unable to hold this level well. Above 7120 could prove out as a reversal event, so watch your edges today in case a reversal is upon us. Losing 7051 could make for another messy downside day as more bearish behavior will trouble buyers. Buyers still have everything to prove today. The bullets below represent the likely shift of trading momentum at the successful or failed retests at the levels noted.
- Buying pressure intraday will likely strengthen with a bullish retest of 7106.75
- Selling pressure intraday will likely strengthen with a bearish retest of 7061
- Resistance sits near 7119.5 to 7136.5 with 7154.5 and 7206.5 above that.
- Support sits between 7045.5 and 7003.5, with 6994.5 and 6976.75 below that.
WTI Crude Oil
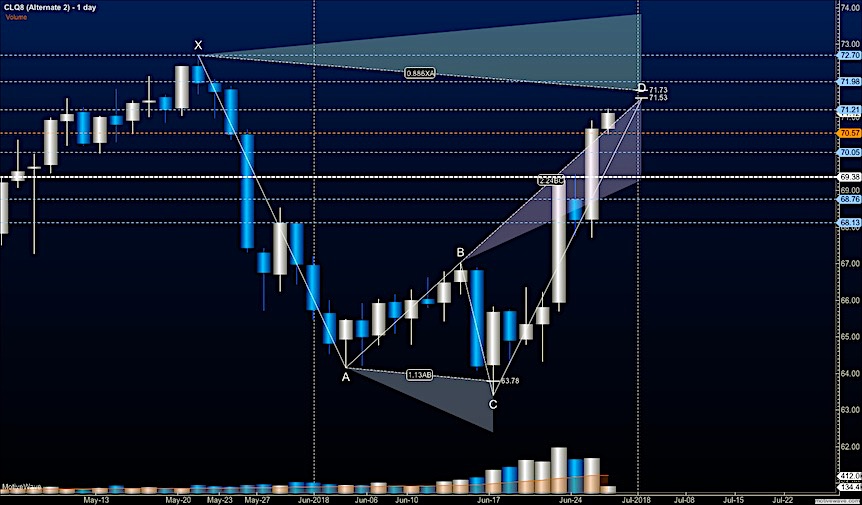
Buyers took full control of this chart yesterday as price lifted into nearby highs for this contract. The EIA report is ahead today. Higher lows should still hold from larger time frames but a fade through this elevator shaft of price is likely. The formation in the image for today for oil is a shark pattern with termination and a PRZ (potential reversal zone ahead). Use caution adding to your positions up at the new highs that may come. The bullets below represent the likely shift of trading momentum at the successful or failed retests at the levels noted.
- Buying pressure intraday will likely strengthen with a bullish retest of 70.98
- Selling pressure intraday will strengthen with a bearish retest of 70.4
- Resistance sits near 71.21 to 71.47, with 71.98 and 72.27 above that.
- Support holds near 70.87 to 70.57, with 70.08 and 69.78 below that.
Twitter: @AnneMarieTrades
The author trades stock market futures every day and may have a position in mentioned securities at the time of publication. Any opinions expressed herein are solely those of the author, and do not in any way represent the views or opinions of any other person or entity.


