TR Equal Weighted Commodities Index “Monthly” Chart
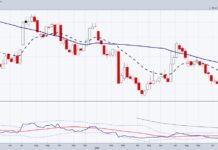
Commodities are nearing a decision point. The Thomson Reuters Equal Weighted Commodities Index is testing the top side of its 7-year falling channel (A) at point (1).
Will the downtrend channel remain intact? Or will Commodities breakout to the upside, providing a bullish signal to investors?
We should know soon enough! The index price is getting sandwiched between the downtrend line resistance (1) and a multi-month uptrend support line (2).
And this is all occurring at a critical Fibonacci retracement level: the 23.6% Fib. This level often characterizes trend changes. So a breakout here would go a long way to helping bulls start a new leg higher.
On the flip side, a move lower that breaks through the uptrend support line would send a frustrating message to bulls. Think Gold, Crude Oil, Natural Gas, Silver, Corn, Wheat, Sugar, and many more commodities.
This is a big spot. And something has gotta give. Stay tuned!
Note that KimbleCharting is offering a 30 day Free trial to See It Market readers. Just send me an email to services@kimblechartingsolutions.com for details to get set up.
Twitter: @KimbleCharting
Any opinions expressed herein are solely those of the author, and do not in any way represent the views or opinions of any other person or entity.


