Key Takeaways:
Price move bringing improved momentum but lack of breadth support could limit strength of rally. Domestic stocks not get support from overseas equities and bounce in copper is coming on concerns of a supply shock. Equity fund inflows back to being a headwind for stocks, with other sentiment indicators showing optimism has risen to levels seen in January.
Market Rally Lacking Broad Support but Optimism Grows
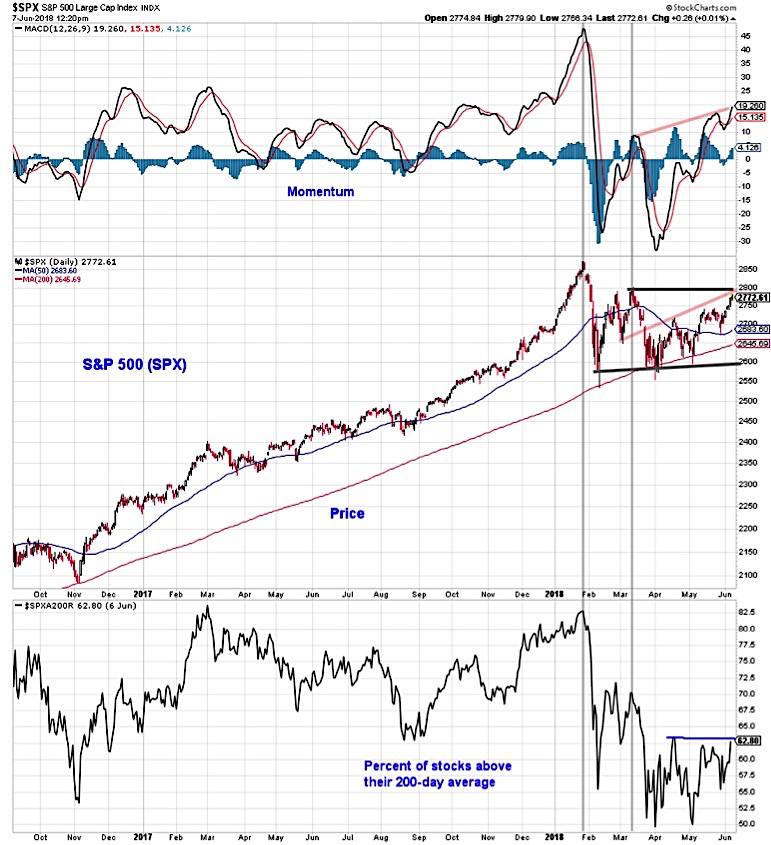
Supported by the recent new highs by the NASDAQ Composite and the small-cap Russell 2000, the S&P 500 has rallied toward resistance near 2800. While this move has been accompanied by improving momentum (including a series of higher highs), the move off of the early May lows has not led to a significant improvement in the breadth backdrop.
Advance/decline lines have returned to new highs, but in both 2011 and 2015, the advance/decline line for the S&P 500 made new highs after the price index had peaked. While the S&P 500 is challenging its March levels, the percentage of stocks in the index trading above their 200-day averages has yet to break above the peak seen in April. Absent an improved breadth backdrop and with investor optimism returning, the recent rally (in not only the S&P 500, but the NASDAQ and small-caps as well) could struggle to build on its recent momentum.
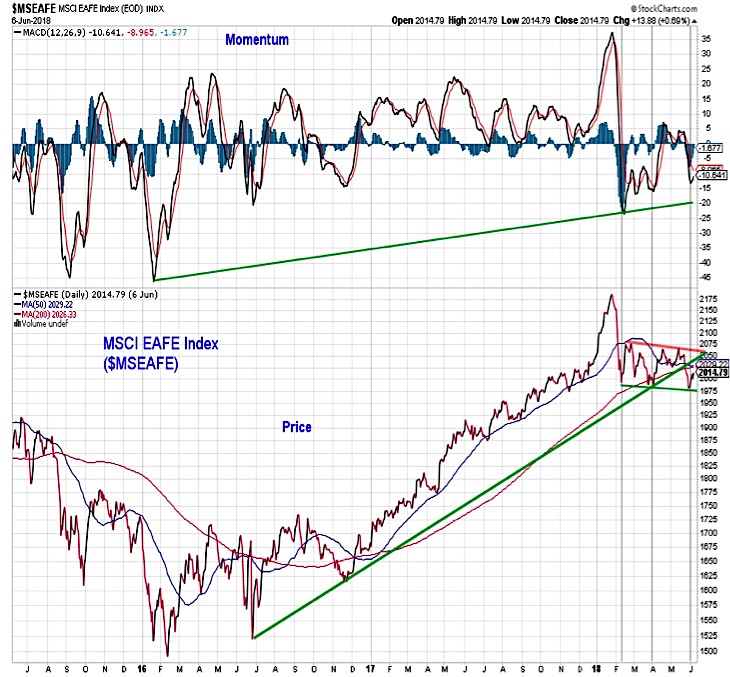
We can measure breadth by looking within indexes for evidence of broad participation. We can also measure it by looking around the world to see whether global equities are supporting domestic stocks. In contrast to what was seen in 2017, the conclusion now is that global rally participation has narrowed considerably. Of 47 country-level indexes, only about half are even above their 50-day averages, let alone challenging their highs. The MSCI EAFE Index has been tracing out a series of lower highs and lower lows, with the most recent new low coming on a break of both the 50-day and 200-day averages (as well as the trend-line that emerged off of the 2016 lows and which had been successfully tested earlier this year). The hopeful news is the momentum on the EAFE has not confirmed the price weakness.
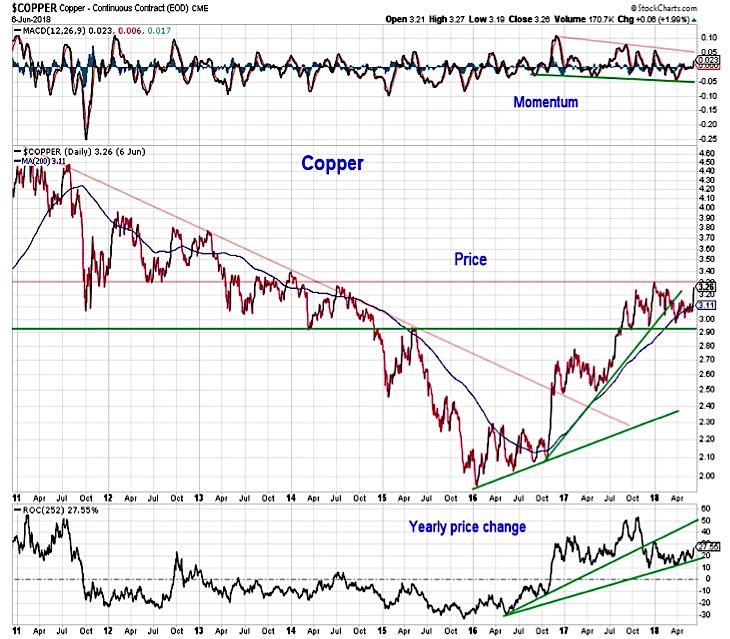
Copper prices have bounced off of their recent lows and are now challenging resistance at the late 2017 highs. For now, copper remains range bound from a price perspective and momentum has yet to signal sustained strength. Copper is typically seen as an economic barometer and a breakout here could suggest accelerating economic growth (helping support a bullish thesis for stocks). However, this price move comes on headlines concerning potential supply shocks (not surging demand). As such we would take a wait-and-see approach, looking for a sustained price breakout that is confirmed on a momentum basis before getting more positive.
Equity fund flows in 2018 have reflected the volatility seen in stocks and the uncertainty (in both directions) on the part of investors. There have been multiple swings between excessive outflows (which tend to be a contrarian bullish signal) and excessive inflows (which have tended to be a bearish signal for stocks). The latest data shows that as stocks have rallied, investors have poured money back into the market, to the tune of $18 billion over the past four weeks. When the four-week flows have exceeded $14 billion, stocks have shown a tendency to struggle.
The fund flow data confirms the evidence of increasing optimism showing up in other indicators. Both the AAII and Investors Intelligence surveys showed an increase in bulls this week, and the NAAIM exposure index moved to its highest level since January. In fact, three-quarters of the investment managers in the NAAIM data reported equity exposure at or above 70%. The most bearish positioning, which was -100% two weeks ago, was +11% this week. Put/call ratios show increased complacency, with the 3-day put/call ratio for equity options dropping to its lowest level since January.
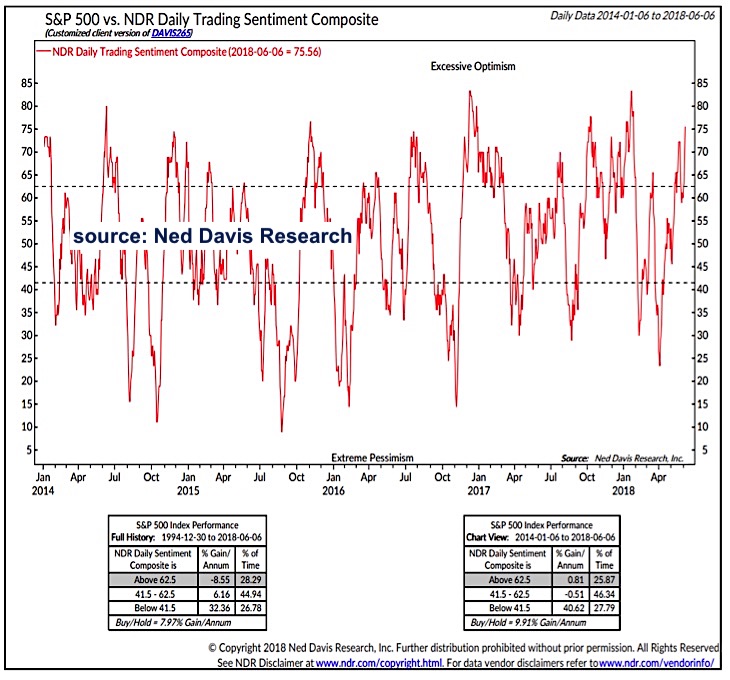
Taken all together, these data points are consistent with NDR Trading Sentiment Composite which has moved back into the excessive optimism zone and is at its highest level since January. Historically, stocks have struggled to hold on to gains when the trading sentiment composite has been this high and all of the net gains in the S&P 500 over the past three-and-a-half years have come when there has been outright pessimism.
Twitter: @WillieDelwiche
Any opinions expressed herein are solely those of the author, and do not in any way represent the views or opinions of any other person or entity.


