The equity markets traded lower last week with the ongoing concerns over rising interest rates, a stronger dollar and global trade.
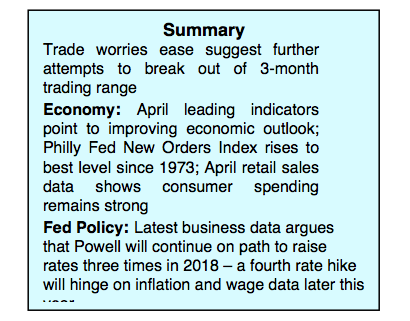
Over the weekend Treasury Secretary Mnuchin said the U.S. and China have agreed to continue negotiations to reduce China’s $375 billion annual trade surplus with the U.S. and that the U.S. will delay tariffs on Chinese imports while these negotiations continue.
This should offer investors some relief over trade concerns; however, we expect that trading jitters will continue as the U.S. still has plans to apply steel and aluminum tariffs on the European Union by month-end.
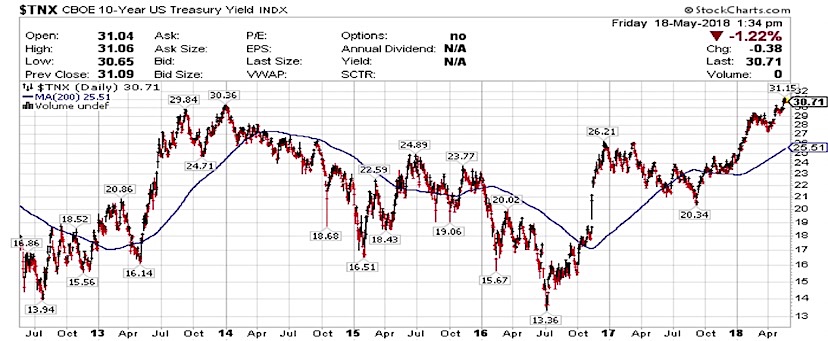
The 10-year Treasury note traded over 3.11% last week, its highest level since 2011, causing concern among investors that rates may go even higher. Higher rates make servicing debt for companies more difficult and offer less room for companies to invest making equities less attractive. Rising rates also provide competition for stocks as Treasury notes now yield more than the average S&P 500 dividend. However, with the recent positive economic indicators, inflation expectations have abated and the Federal Reserve remains on its path of gradual rate hikes reflecting a healthy economy.
10 Year Treasury Note Yield Chart
Over the very near term, we view the uncertainty surrounding trade, interest rates and rising energy costs likely to keep the equity markets in a trading range.
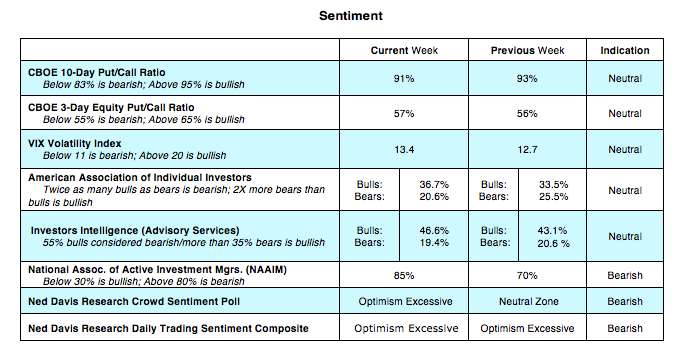
The technical backdrop is mixed. The broad market continues to underperform with less than 60% of S&P 500 stocks trading above their 50-day moving average. We are also concerned, from a contrarian standpoint, that indicators of investor sentiment have flipped from concern and skepticism to outright optimism. This is seen by the fact that the demand for put options has slowed while surveys of investor psychology for individuals and professional money managers show a stronger willingness to accept more risk.
The widely followed Ned Davis Trading Sentiment Guide also moved from neutral to extreme optimism. Offsetting the negatives is the flow of funds data that remains bullish. Investors have funneled significant cash into stock mutual funds and ETFs the past two weeks. More importantly, corporations are buying their own stock back in record amounts. It is estimated that corporate buybacks will be near $180 billion in the first quarter. The surge in buybacks is anticipated to continue with corporate repurchases hitting a new all-term record high in 2018. The fact that capital expenditures also hit a record $158 billion in the first quarter is an indication that corporations are flush with cash. We are still waiting on a signal from market breadth indicators that stocks will break out on the upside. This would require a substantial improvement in upside volume and or 80% of S&P 500 issues trading above their 50-day moving average.
Twitter: @WillieDelwiche
Any opinions expressed herein are solely those of the author, and do not in any way represent the views or opinions of any other person or entity.


