Over the past couple years, I have written several posts about IBM.
And in most instances I was looking for opportunities to get LONG the stock for a swing trade.
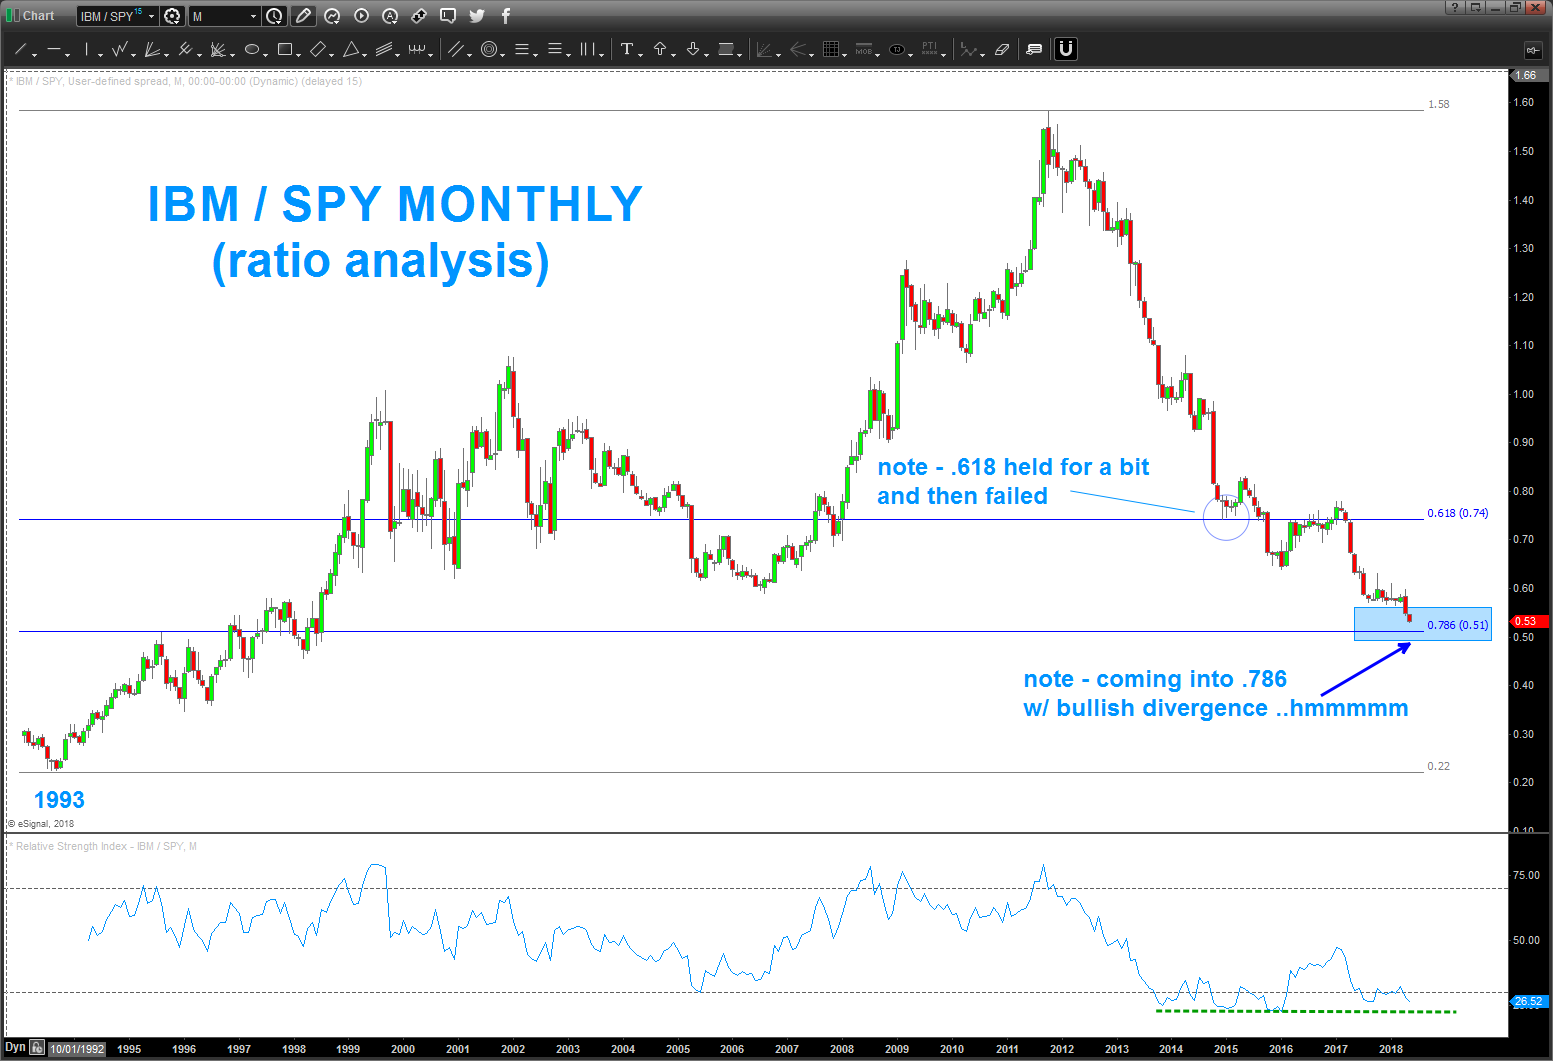
At certain junctures, there have been hints, using a technical analysis technique called ‘ratio analysis’, that IBM has the potential to start outperforming the broader S&P 500 index.
Here’s a quick recap of those blogs:
- Why IBM Stock May Reverse Higher In 2015
- The level we were looking at in that post held and IBM rallied.
The next post in this series, showed the potential of the breakout from an inverse head and shoulders to target a very formidable gap:
“If the breakout holds, investors will have an 8 dollar gap staring them in the face. That will be a big test…”
- IBM Stock Update: Is a Breakout Underway?
- The gap did prove to be formidable resistance and it caused IBM to plunge to new lows.
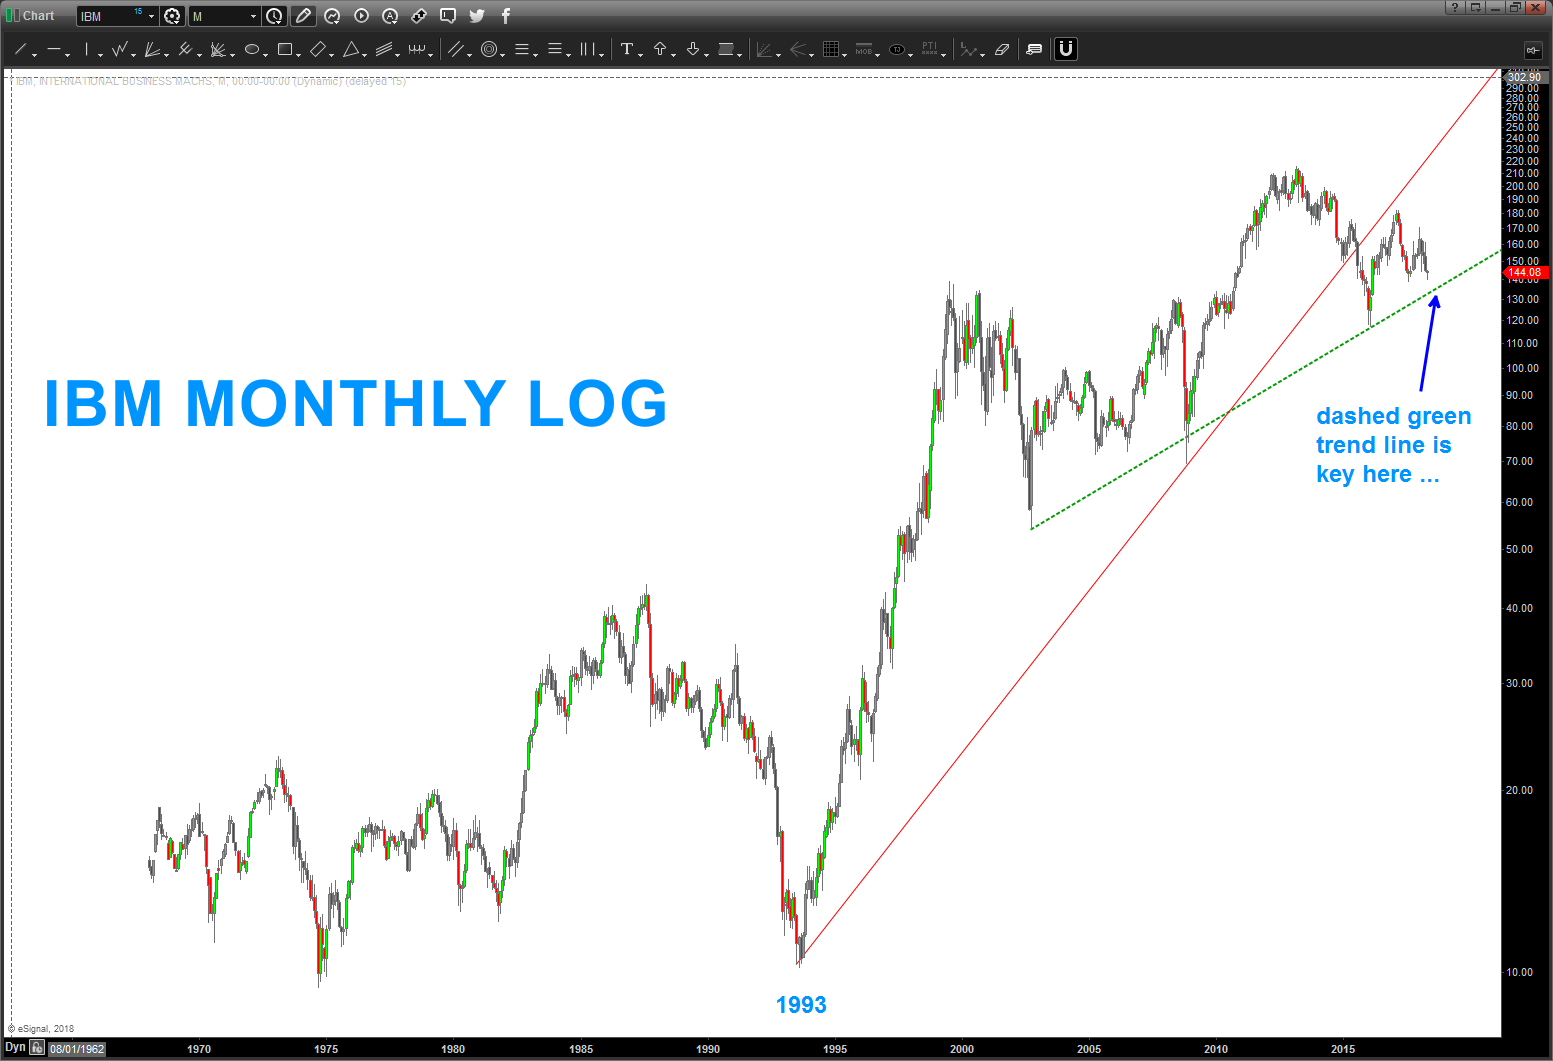
Next, we saw a long term trend line (LOG) get taken out from 1993 and now we are testing another key trend line. (dashed green). The trend line discussion can be found here:
So where does that leave us now?
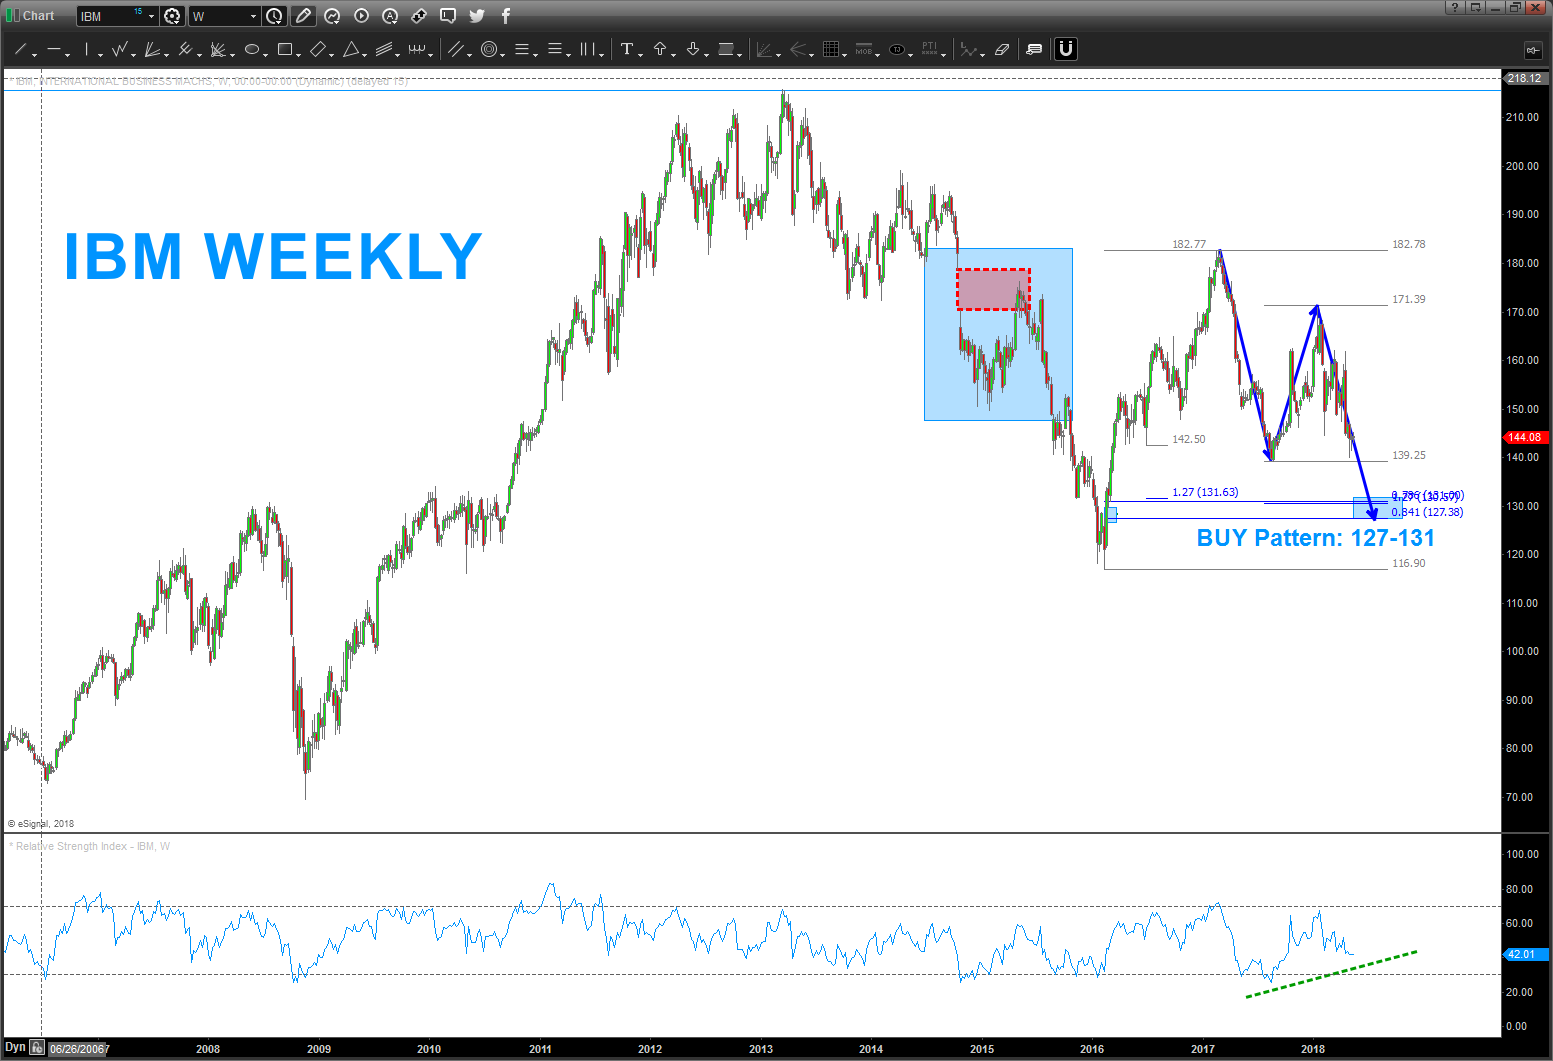
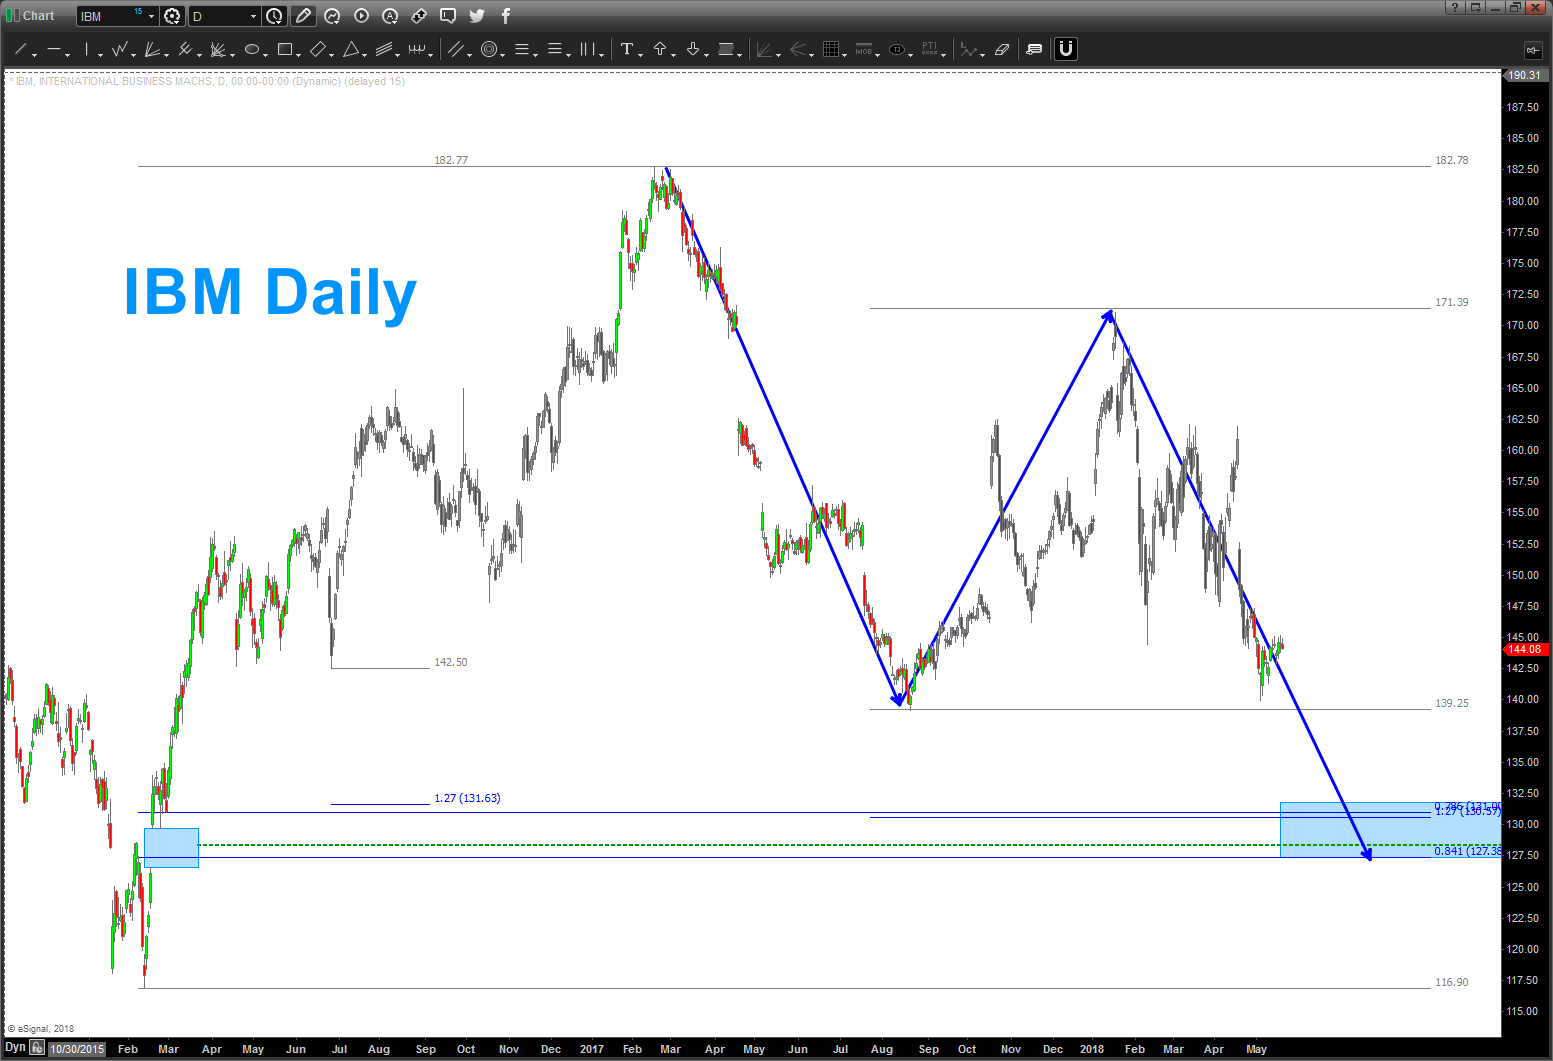
I have updated several charts below – monthly, weekly, daily, and LOG charts. We have a very nice BUY PATTERN forming a little lower while also targeting the 25 year .786 retracement node of the IBM/SPY ratio.
Folks, if we can get a synchronistic pattern completing while at the same time a .786 retracement of the ratio, I believe this is a very risk controlled opportunity to go long IBM.
$IBM Ratio Analysis – MONTHLY
$IBM – WEEKLY
$IBM – DAILY
$IBM Log Trend Line
Be sure to check out my unique analysis of stocks, commodities, currencies over at Bart’s Charts. Stay tuned and thanks for reading.
Twitter: @BartsCharts
Author does not have a position in mentioned securities at the time of publication. Any opinions expressed herein are solely those of the author, and do not in any way represent the views or opinions of any other person or entity.


