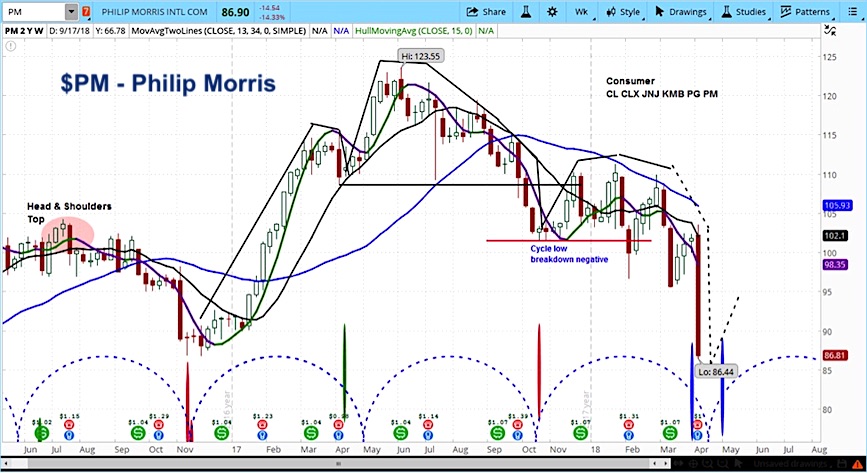
Philip Morris International (PM) traded 14% lower on Thursday morning, after reporting earnings that beat Wall Street expectations but missed on revenues.
Whoa!
Philip Morris reported earnings per share of $1.00 and total revenue of $6.9 billion, compared to analyst expectations of $0.90 and $7 billion.
The company updated its FY18 guidance to $5.25 to $5.35, compared to estimates of $5.28. However, they also discussed problems on the Gulf Coast, Russia, and Japan.
In analyzing Philip Morris (PM) weekly chart below, the stock is approaching the end of the declining phase of its current market cycle. This could mean that the stock is capitulating, with a bottom due in the next couple of weeks.
The fact that the stock is ending this cycle with a lower price than when it began it means that the trend continues to be negative. Thus, the coming rebound is likely to be temporary.
Philip Morris (PM) Stock Chart with Weekly Bars
For an introduction to cycle analysis, check out our Stock Market Cycles video.
Twitter: @askslim
The author may have a position in mentioned securities at the time of publication. Any opinions expressed herein are solely those of the author, and do not in any way represent the views or opinions of any other person or entity.


