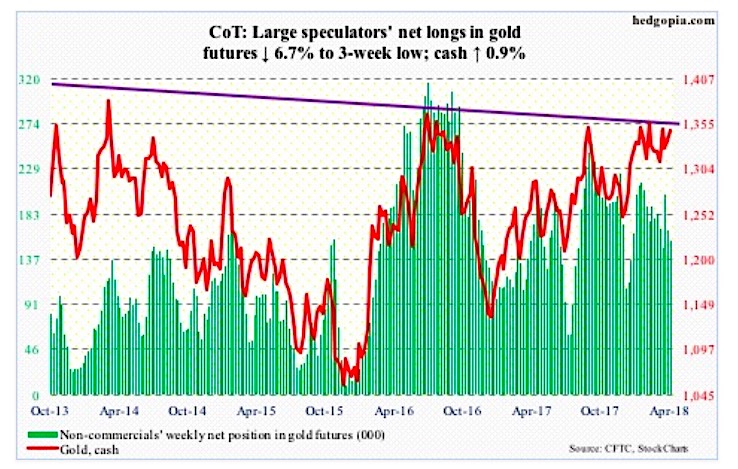
The following chart and data highlight non-commercial commodity futures trading positions as of April 10, 2017.
This data was released with the April 13 COT Report (Commitment of Traders). Note that these charts also appeared on my blog.
The chart below looks at non-commercial futures trading positions for GOLD. For the week, spot gold prices traded higher by +0.9%.
GOLD Futures
Gold: Currently net long 155.4k, down 11.2k.
One more week, one more attack on resistance at $1,360-70/ounce on the cash, and potentially one more failure. Looks like gold bugs will have to continue to wait for a breakout.
Wednesday, the metal ($1,347.90) rallied intraday to $1,369.40 before ending the session up 1.1 percent to $1,360, leaving behind a little bit of a tail. The daily upper Bollinger band lied right there.
The latest rally came post-defense mid-March of crucial support at $1,300. The daily chart is overbought. In a worse-case scenario for the bulls, this gets tested near term. The lower Bollinger band lies just north of $1,300, and the 200-day at $1,297.94.
Encouragingly for the bulls, flows have improved of late. In the week through Wednesday, SPDR gold ETF (GLD) attracted $341 million and iShares gold trust (IAU) $225 million (courtesy of ETF.com). In the past four, $655 million and $1.1 billion moved into the two, in that order.
Twitter: @hedgopia
Author may hold a position in mentioned securities at the time of publication. Any opinions expressed herein are solely those of the author, and do not in any way represent the views or opinions of any other person or entity.


