Is gold ready for primetime?
The shiny metal is testing the $1360-$1370 level for the fourth time this year.
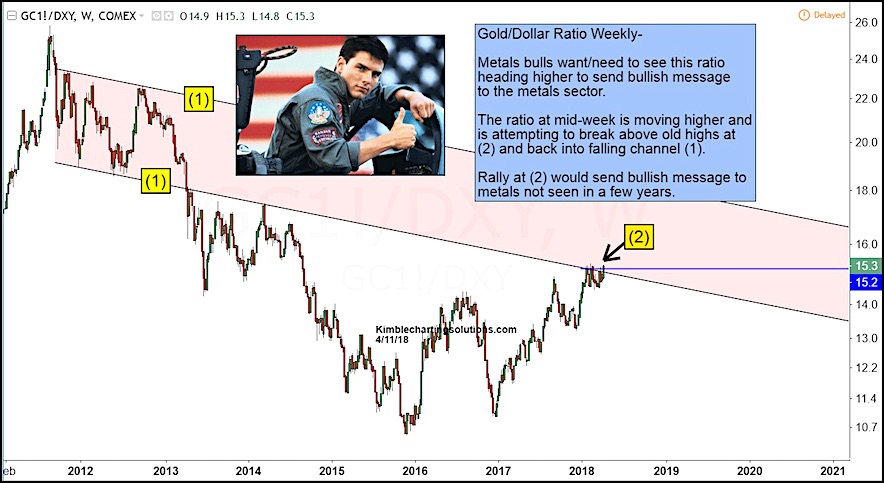
One factor that has helped to keep Gold elevated is a weaker U.S. Dollar. The chart below highlights the Gold/U.S. Dollar ratio. Metals bulls want/need to see this ratio heading higher to send a bullish message to the broader metals sector.
As you can see below, this ratio has consolidated near its 2018 highs and is attempting to break out. It’s been a long tiring battle with plenty of set-backs for metals bulls over the last 5 years… but they aren’t giving up easily. A breakout here could produce another gold rush.
The ratio at mid-week is moving higher and is attempting to break above old highs at (2) and back into its falling price channel (1).
A breakout here would send a bullish message to metals investors, one not seen in a few years. Gold is knocking, will the bulls answer?
Gold/U.S. Dollar Ratio “Weekly” Chart
Note that KimbleCharting is offering a 30 day Free trial to See It Market readers. Just send me an email to services@kimblechartingsolutions.com for details to get set up.
Twitter: @KimbleCharting
Any opinions expressed herein are solely those of the author, and do not in any way represent the views or opinions of any other person or entity.


