There has been a lot going on this year, and while the stock market has grabbed most of the headlines, something has been going on in a corner of the market that should not be ignored.
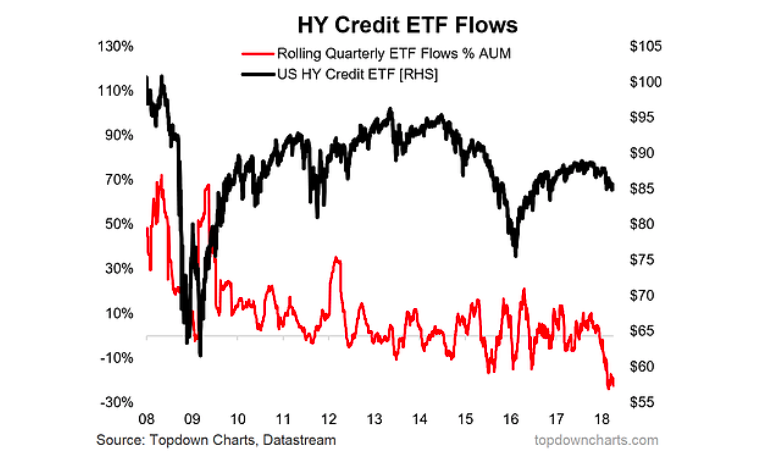
US high yield credit ETFs (also known as junk bonds), have seen what almost amounts to a run on assets.
What’s interesting about this is that most of the time a run on assets is triggered by losses, and when you think about junk bonds you probably think about defaults and blow outs in credit spreads like what happened in 2008.
But this run was triggered by the generalized rise in bond yields. AKA duration risk. This is in contrast to credit risk (what I just described). I think most investors (or at least I would hope!) should be well aware that junk bond ETFs carry credit risk in the form of spread widening, defaults, and downgrades, but ETFs like this are also exposed to plain old interest rate risk.
With government bond yields in the process of a corrective pullback, this risk has temporarily abated, but it goes to show that with the big run of outflows, investors were clearly caught off guard.
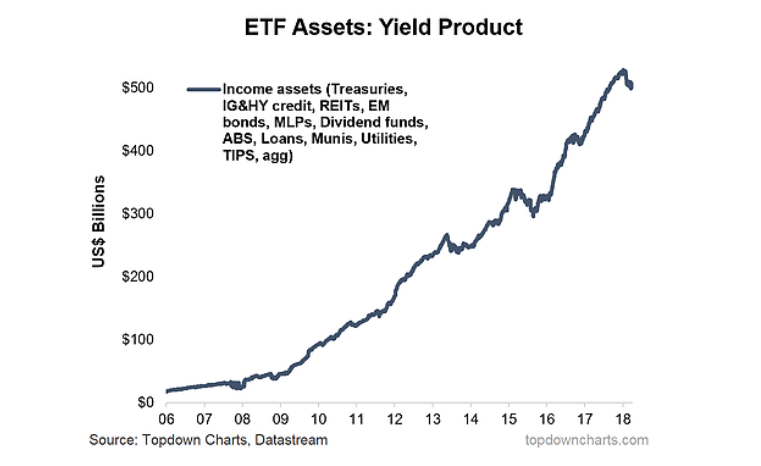
As there has been over $500B amassed in various income oriented ETFs, this episode should serve as a wake up call to the sometimes hidden or less obvious risks in the income asset jungle.
The key takeaways on high yield credit flows and the rise of income asset investing are:
– HY Credit ETFs have basically seen a run on assets this year.
– This run was spurred primarily by losses driven as a result of rising bond yields, with credit spreads relatively contained for now.
– It highlights some of the ‘hidden’ risks across the spectrum of income assets that investors may have unwittingly amassed in the “search for yield”.
1. High Yield Credit ETF Flows: Since the peak last year, US high yield credit ETF AUM has dropped from around $43B to around $32B, and as the flows indicator below shows (which is normalized for price changes and standardized against Assets Under Management), there has been a run on US HY ETFs. Interestingly enough this run seems to have only been triggered by the rise in bond yields as credit spreads have been relatively contained, for now at least. It warrants monitoring as things could change quickly, particularly as the outlook for credit spreads is looking less certain by the day.
2. Income Oriented ETF AUM: It gives a nod to this classic chart (in this case fell about $30B from the peak of $530B), which shows I would say both an element of a structural rise in demand, as well as a cyclical surge in the “search for yield” regime – where investors have been pushing out the risk and duration curve to obtain more income. But the game is slowly changing here as government bond yields push higher and the fed funds rate moves through the normalization process – offering investors better returns in safer places. Indeed, the chart below made me wonder last year as to whether we are witnessing a bubble in income assets. It may or may not be the case, but the last couple of months (should!) have given investors a wake up call about hidden risks in some of these yield plays…
Twitter: @Callum_Thomas
Any opinions expressed herein are solely those of the author, and do not in any way represent the views or opinions of any other person or entity.


