The Nasdaq 100 has seen some price volatility in February but the large cap tech index is still in position to move higher…
If a key price level holds into February’s month end close.
Let’s look at a couple charts to see what’s next for the Nasdaq 100 and large cap tech stocks.
Nasdaq 100 Monthly Chart
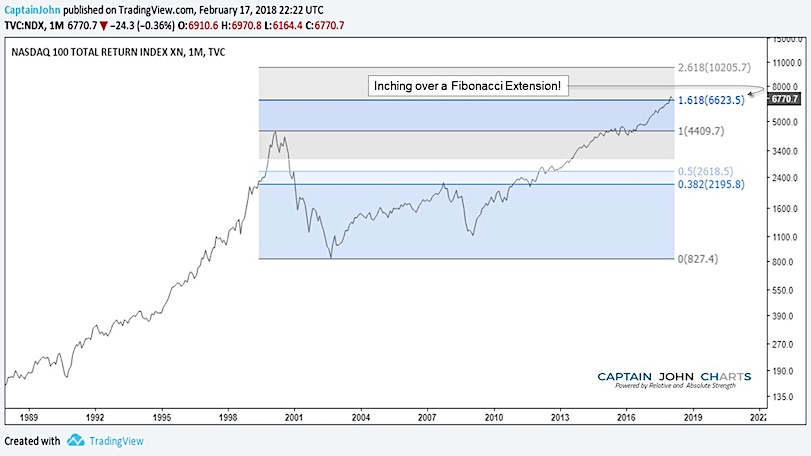
The Nasdaq 100 has so far broken out above the 1.618% Fibonacci Extension.
Tech bulls need the monthly close to hold above this price level. This would be bullish and could bring higher price targets into view once more.
Nasdaq 100 Daily Chart
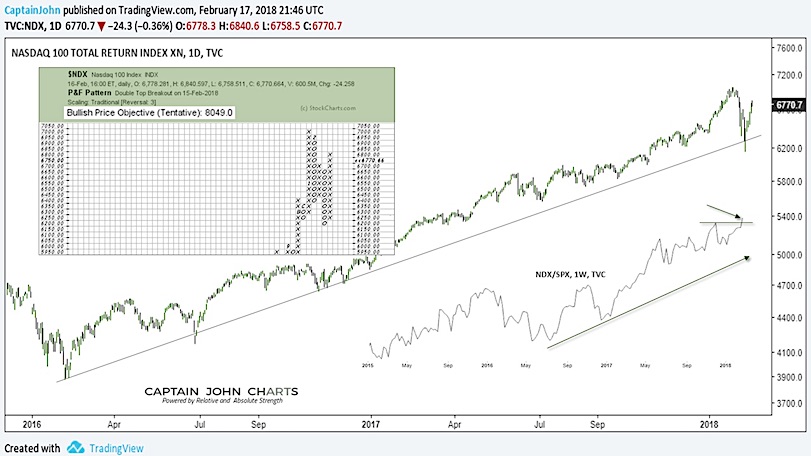
The daily chart remains in an up-trend off the 2016 lows. And as long as the trend remains intact, bulls remain in charge. Point & Figure charting suggests a longer-term price objective of ~8050.
As a side bar, it also worth noting that the Nasdaq 100 is breaking out relative to the S&P 500 on a weekly chart (not shown). As long as the trend stays in tact, tech stocks may march higher once more.
If you are interested in learning more about our investing approach and financial services, visit us at CaptainJohnCharts.
Twitter: @CptJohnCharts & @FortunaEquitis
The author may have a position in mentioned securities at the time of publication. Any opinions expressed herein are solely those of the author, and do not in any way represent the views or opinions of any other person or entity.


