iShares 20+ Year Treasury Bond ETF (TLT)
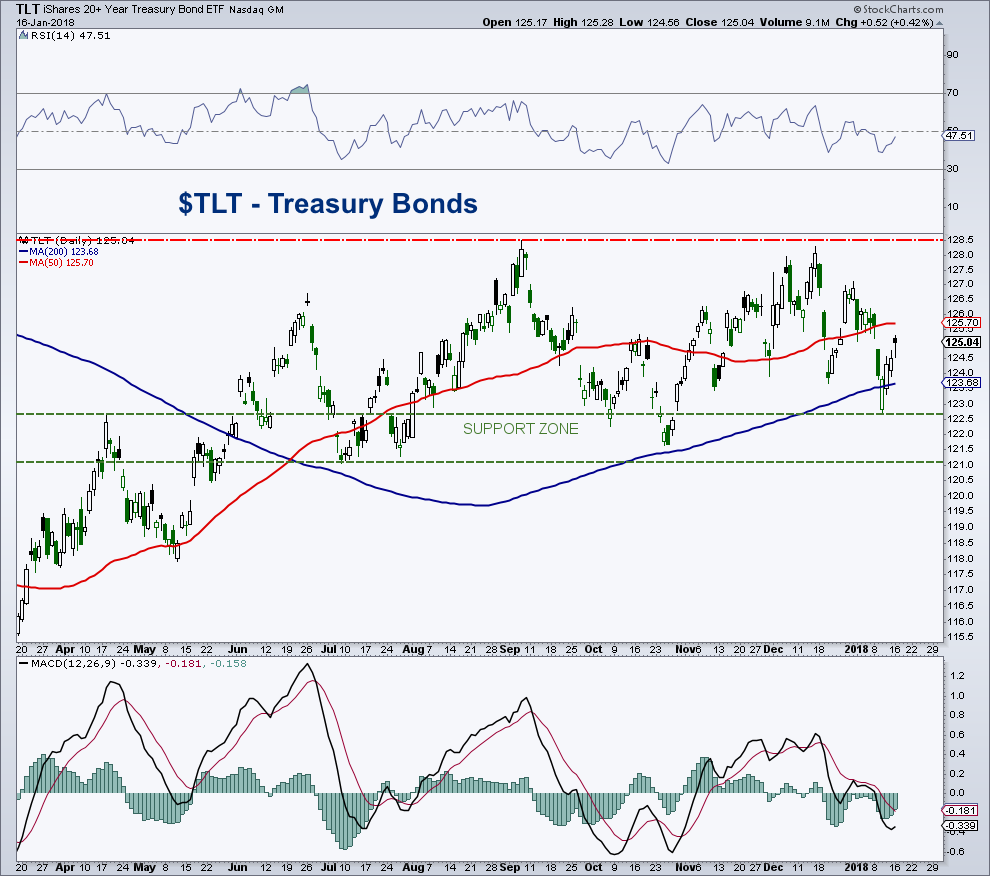
On the daily chart (shown below), TLT remains extremely subdued, showing little change over the past seven months. Range bound markets are great to trade after the fact but not the easiest to predict when they are coming.
Looking at the chart, you can see the back and forth action over the past 6 months.
So what will it take to signal a bigger directional move?
On the upside, a break above the September high of 128.50 could then see a measured move up to heavy chart resistance in the 132 to 134 region.
On the downside, only a break of the 121/122 region would be concerning. The COT data and market sentiment for the 10-year remains neutral, but bearish for the 30-year. I am currently flat the treasury market.
$TLT Chart – 20+ Year Treasury Bond ETF
Feel free to reach out to me at arbetermark@gmail.com for inquiries about my newsletter “On The Mark”. Thanks for reading.
Twitter: @MarkArbeter
The author does not have a position in mentioned securities at the time of publication. Any opinions expressed herein are solely those of the author, and do not in any way represent the views or opinions of any other person or entity.


