It’s been a while since gold bulls were able to celebrate something more than a swing trade.
Will 2018 bring gold bulls the breakout they’ve been patiently waiting nearly 5 years for?
Since the 2011 top, there has been plenty of failed rallies and sideways grinding. But the last 13 months have seen another rally in gold prices and helped to solidify what appears to be a multi-year basing/bottoming formation. The recent rally has also formed a right shoulder within a potentially bullish inverse head & shoulders multi-year pattern – we wrote about this in late December.
One of the biggest influences on Gold’s move higher has been weakness in the US Dollar. When King Dollar is weak, Gold tends to get a lift.
800 Pound Resistance Test!
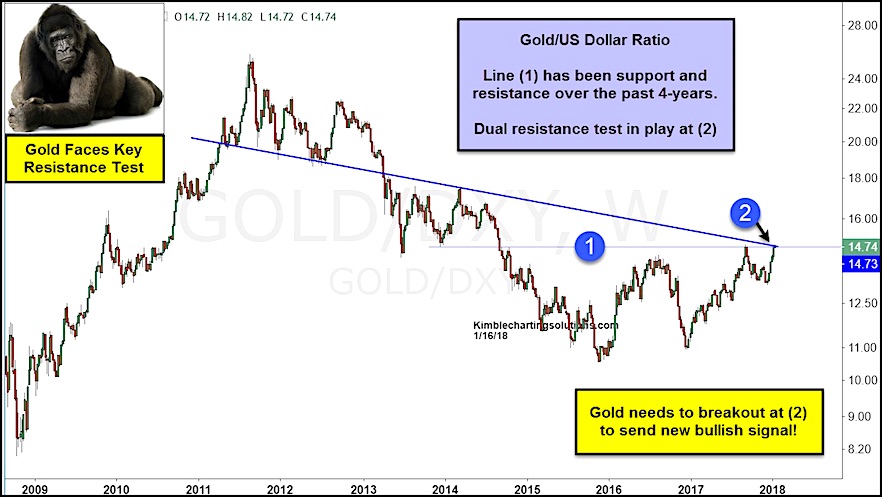
Below is a chart of the Gold/US Dollar ratio. As you can see, this ratio has been trading higher of late and is currently trading right up against a dual resistance area. Line (1) offered support in 2013-2014 and is now serving as resistance. Line (2) is a multi-year trend line that offered support in 2011-2012 and has been resistance ever since. These resistance lines are converging right now.
This is a BIG TEST for the Gold/Dollar ratio. For Gold to have a chance to move higher, it needs to take out dual resistance at (2).
Gold to U.S. Dollar Ratio – Breakout Coming?
ALSO READ: Silver To Gold Ratio At Important Juncture
Twitter: @KimbleCharting
Any opinions expressed herein are solely those of the author, and do not in any way represent the views or opinions of any other person or entity.


