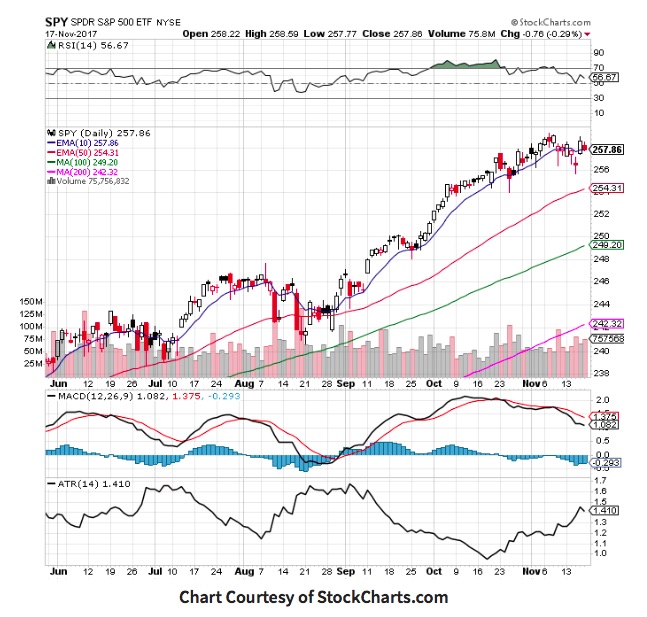
The SPDR S&P 500 ETF (NYSEARCA:SPY) fell -0.2% last week but did show resiliency mid-week.
That said, the S&P 500 has traded sideways for 4 weeks.
Stay disciplined and tune out the noise – your process and strategy should keep you in your trades until it stops working. Stay alert on $SPY as it may be in a transition phase.
Here’s a look at 10 chart signals occurring right now:
- Price remains near all times high.
- Price is above all key moving averages.
- $SPY is beginning to transition from an uptrend to a trading range with $255.63 as support and all time highs is resistance.
- The 10 day EMA failed to hold as end of day support last week as the market began to go sideways.
- RSI is at 56.67 and remains bullish.
- Down days had more volume than up days last week showing profit taking at higher prices.
- MACD remains under a bearish cross over.
- The trading range continues to expand as measured by the ATR.
- Volatility continued to expand and then contract ending at a 11.43 $VIX.
- These mixed signals are pointing to another week of trading inside a price range on a likely low volume holiday week.
Thanks for reading.
Twitter: @SJosephBurns
Any opinions expressed herein are solely those of the author, and do not in any way represent the views or opinions of any other person or entity.


