In this week’s investing research outlook, we will analyze the current trends of the S&P 500 Index (INDEXSP:.INX) and Russell 2000 Index (INDEXRUSSELL:RUT), check in on market breadth and investor sentiment indicators, and discuss current themes and news that we are watching in the financial markets.
Here’s a summary of our findings for the week ending October 27, 2017:
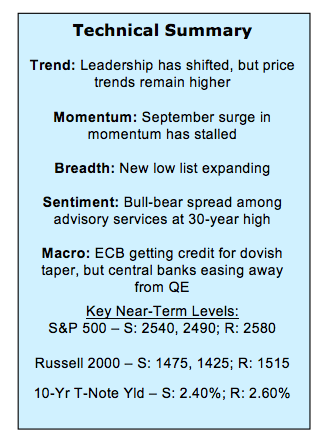
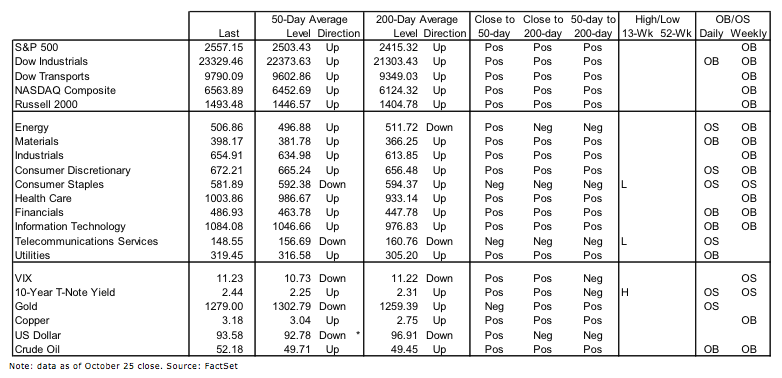
Uptrends Intact – While leadership has shifted (from small-caps in September to the Dow Jones Industrials in October), up-trends in the popular averages remain intact. Supporting these trends is a continued expansion in the percentage of industry in up-trends and seasonal tailwinds heading into year-end.
Stocks Could Be Set Up For Some Consolidation – As October has progressed, however, there is increasing evidence that stocks could be due for consolidation or even a modest pullback. The upside momentum that emerged over the course of September has cooled and investor sentiment, by most measures, continues to show excessive optimism. Even where optimism has retreated somewhat, the pessimism that has accompanied stock market gains in recent years has yet to emerge.
Bond Yields Moving Higher – Bond yields have moved off of their recent lows and the 10-year Treasury Note Yield (INDEXCBOE:TNX) has broken above 2.4% (after twice failing to get above that level). The trends and momentum in yields are to the upside. While optimism in bonds has receded, we have not yet seen evidence of excessive pessimism (which could suggest yields have peaked, at least on a short-term basis).
Stock Market Indicators:
S&P 500 Index
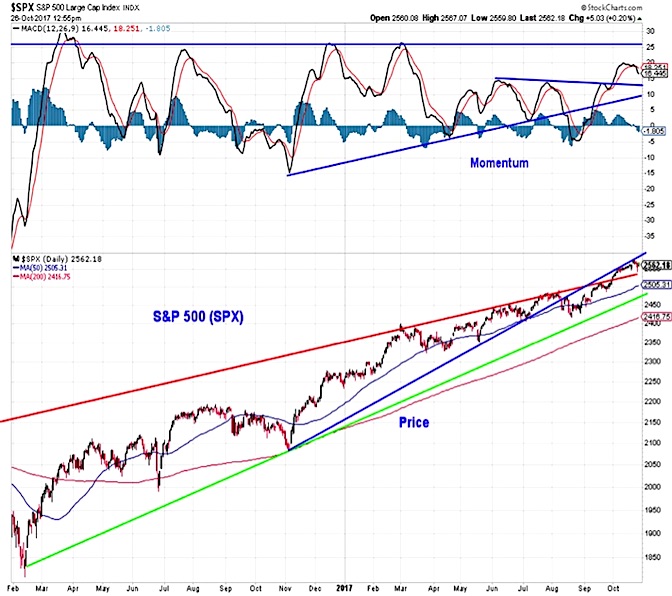
The S&P 500 is less than a week removed from its latest all-time high, while the Dow Industrial Average made its latest new high two days ago and is up more than 4.5% in October. Price trends remain strong, but the surge in momentum that emerged off of the August lows has cooled as October has progressed. This could set up the S&P 500 for some near-term consolidation. Initial support is near 2540, although a pullback towards 2500 could help unwind investor optimism and leave the index well positioned to rally into year-end.
Russell 2000 Index
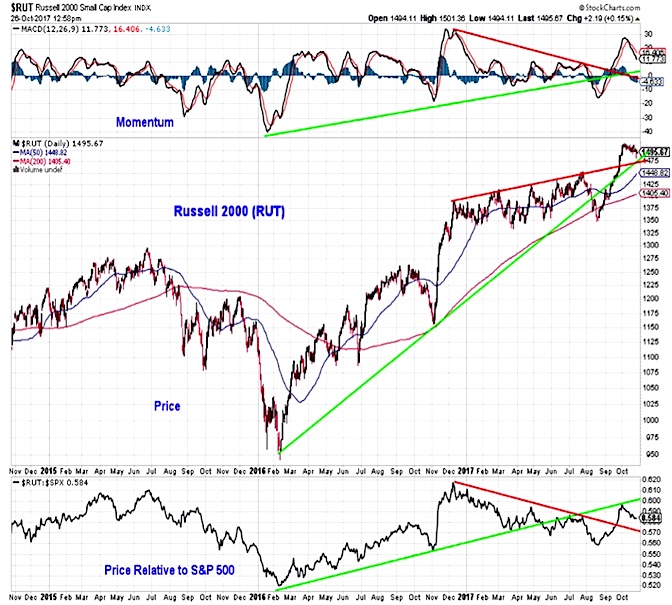
Small-caps surged in September, but have been struggling to stay in positive territory for October as the month has progressed. Similarly to the S&P 500, momentum has cooled for small-caps as well. While the Russell 2000 garnered a lot of attention last month, the rally on a relative basis (versus the S&P 500) failed to change the longer-term trend dynamic. After making progress versus large-caps in 2016, small-caps have struggled over the course of 2017.
Investor Sentiment
The Investors Intelligence survey of advisory services showed an up-tick in bullish sentiment and down-tick in bearish sentiment this week. The spread between bulls and bears expanded to its highest level in 30 years.
The NAAIM survey of active investment managers rose slightly this week and optimism there remains generally elevated. The details of the survey show managers moving away from the median – the bullish camp became more bullish and the bearish camp became more bearish.
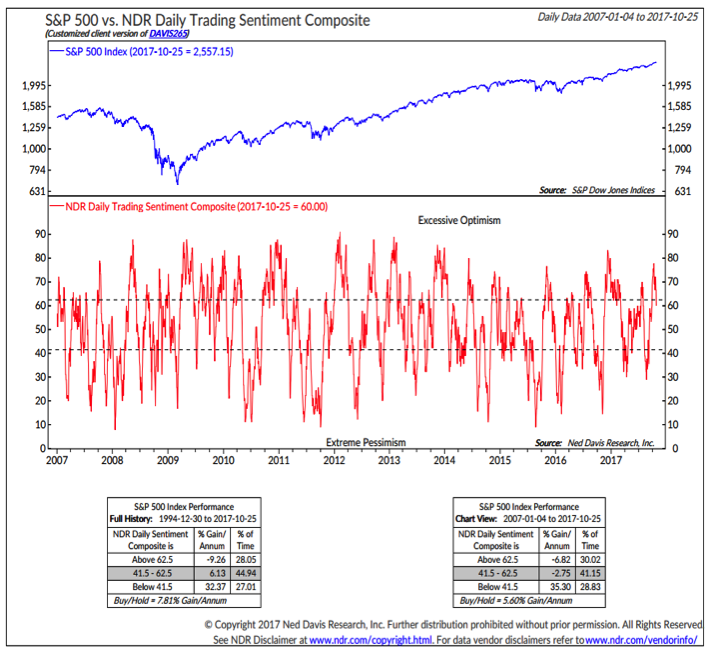
Our favorite short-term measure of sentiment, the NDR Trading Sentiment Composite, shows that optimism has eased somewhat recently, but remains far from showing excessive pessimism. All the net gains in stocks over the past 10 years have come when this indicator has shown pessimism.
Market Breadth
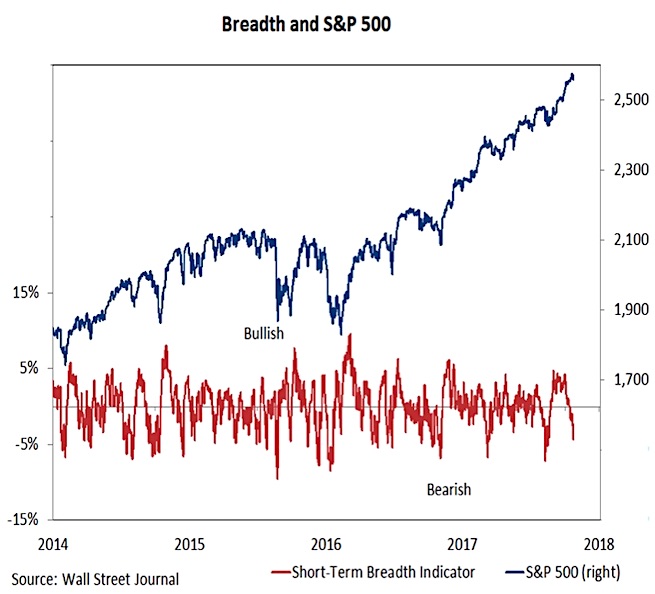
It is not only at the index level the momentum has cooled in October. Broad market momentum, as measured by this short-term breadth indicator, has turned sharply lower as the month has progressed. This could leave the indexes vulnerable in the near term. In addition to deteriorating momentum, the percentage of stocks trading above their 50-day and 200-day averages has contracted. The number of stocks making new highs in recent trading sessions has contracted and the new low list has expanded.
continue reading this article on the next page…

