Noble Energy (NYSE:NBL) has a stock chart that got ugly within the Gas & Oil sector that has been very out of favor during the recent portion of the 8-year bull run in the stock market. However, Nobel Energy (NBL) may be poised for a major bounce…
Today we’ll explore the technicals and multiple perspectives that we walked down to arrive at our current conclusion.
The bearish one hasn’t enough evidence to fire a short; but the bullish one has an edge.
This bearish stock is not like the others. It may end up like an epic whale tale.
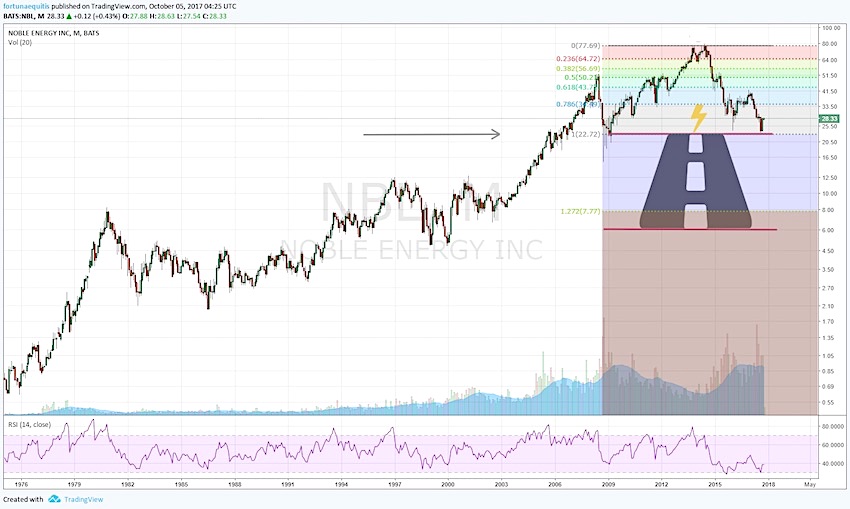
One look at Noble Energy’s Monthly (Long Term) stock chart below and you’ll see why in dawns first light it could resemble a smelly matted bear. There is about to be a major level test. It falls right on a key Fibonacci level at the price of $22.72. The retracement lands on my red line under a midterm support since 2009 and it appears to be a double top or formation of a head and shoulder pattern.
If that played out, NBL’s stock price would fall approximately at the end of the road depicted on the chart.
Is there an end to this road or a major reversal to the upside in this crossroads moment?
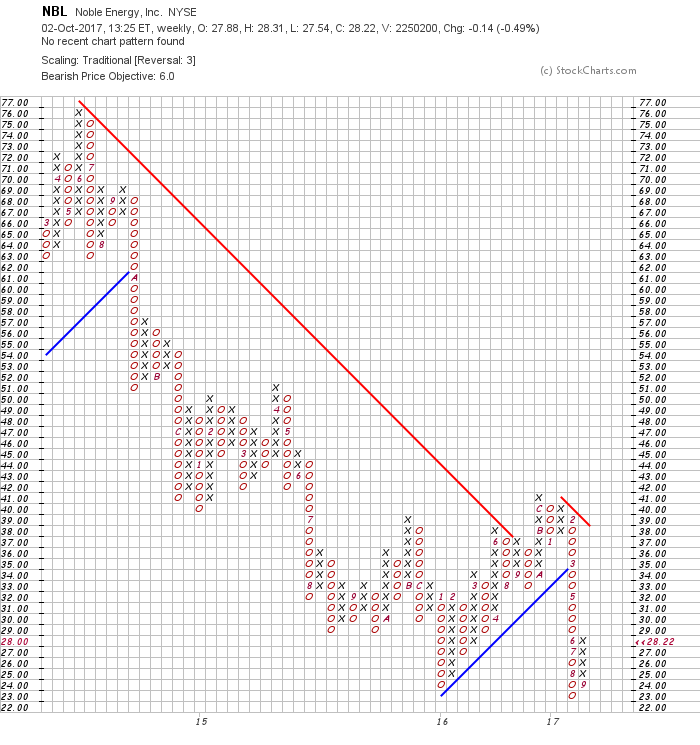
The end of the road ends at the number 6. The Head and shoulders target decline would be to approximately the $6 range and so is the bearish price objective on a Point and Figure stock chart. That would be a messy disaster.
The Point and Figure chart gives a great picture of what it looks like when price in a stock just keeps trading below the Bearish resistance line. So, if that key level of $22.72 goes, so goes Noble Energy stock at these price levels.
Next long-term support going back to 2002-2003 is at $6. Hmmm…
Successful investing requires adaptation and acceptance that there are reasons behind the movement of price regardless of a fundamental story. Often long before we are prepared to accept it. We should be prepared to accept that the downtrend is at a crossroads for an epic move.
Price support may break down or… It may make a hard bounce here at this level.
It will require the profiting short side to adapt and the reluctant long to hold their nose, check their gut and take the appropriate entry in order to capture the majority of the move. Noble Energy’s recent short-term underperformance is at a crossroads. I drew the red line in the sand at the level to watch.
ANOTHER PERSPECTIVE
Is this a bullish gift that holds a major opportunity?
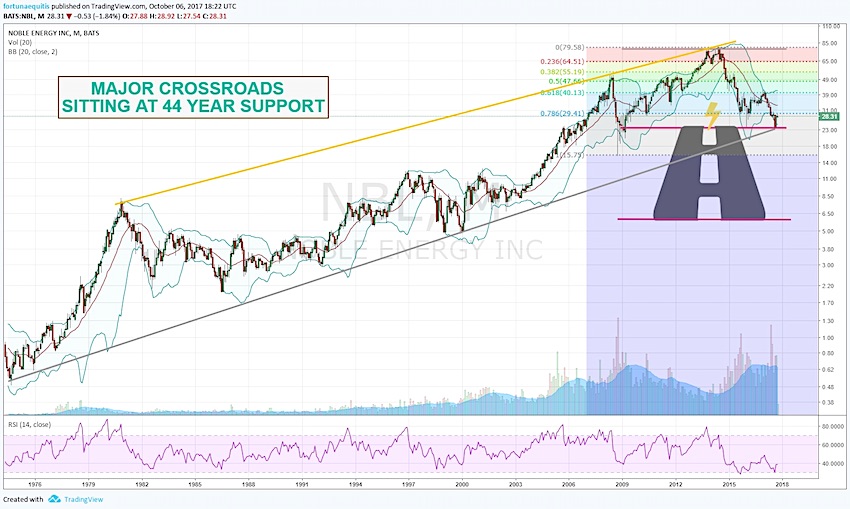
Take another look at the Monthly stock chart with the trend channel showing the very long-term support. Price is testing 44 years of support; (lower gray trend channel) as it has twice before in this chart going back to 1976.
Take a look at a different perspective with the Bollinger bands overlaid on the chart. When price hits the bottom band it bounces and in this case, it has even overshot the bottom band a bit. The Major Long-Term trend channel has price sitting there on support as well.
This is a buying gift from the angels if Noble Energy can hold this level and continue to bounce here. Usually bounces of such long-term support rip. Johns inner Technical Analysis animal spirit is screaming buy-buy-buy with a tight stop.
This could be one hell of a ride.
ETFS HOLDING $NBL / % OF ETF HOLDING *
- $FCG First Trust Natural Gas ETF 5.92%
- $RYE Guggenheim S&P 500 Equal Weighted Energy EFT 3.26%
- $FRAK Unconventional Oil & Gas ETF 3.21%
- $FTXN First Trust Nasdaq Oil & Gas ETF 2.93%
- $XOP SPDR S&P Oil & Gas Explor & Prodtn ETF 2.07%
- $XLE 1.16%
*Partial List
If you are interested in learning more about our investing approach and financial services, visit us at captainjohncharts.com.
Twitter: @CptJohnCharts & @FortunaEquitis
The author has a position in the mentioned securities. Any opinions expressed herein are solely those of the author, and do not in any way represent the views or opinions of any other person or entity.


