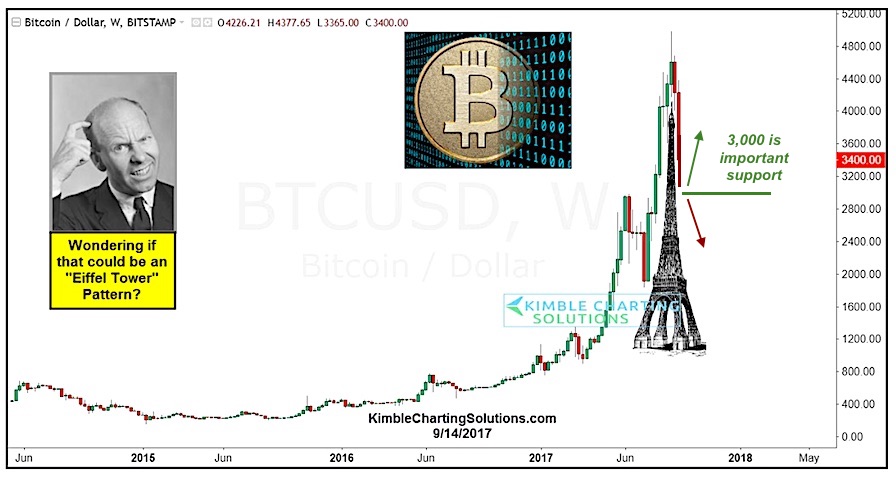
Bitcoin peaked earlier this month around $4,950… but last week was brutal for short-term bull traders.
A slight slip in early September gave way to a slide into mid-September as Bitcoin (CURRENCY:BTC) fell briefly by nearly 40% (peak to recent tough), briefly touching just under $3,000 on Friday. So today’s rally is welcome news for Bitcoin bulls.
The cryptocurrency is bouncing and bulls want to see a lot more of that to avoid a deeper selloff.
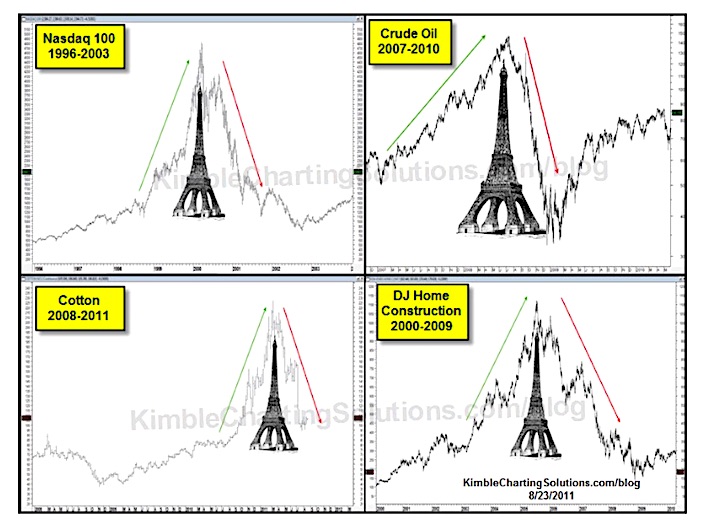
When speculation shifts into another gear we often see parabolic moves… and sometimes there are multiple fractals within a larger move (with the final burst shooting nearly straight up). This type of price pattern can produce an Eiffel Tower Pattern… what goes up sharply can often come down sharply.
Here’s a look at some different assets throughout recent history that have seen this price pattern play out.
ALSO READ: Gold / U.S. Dollar Ratio Racing to a Peak?
One could argue that Bitcoin has already seen a steep correction and that it’s now time to ascend once more. Especially in light of today’s rally and the fact that Bitcoin held $3,000. However, bulls will still need to build on today’s bounce… because if it turns lower once more, this pattern could take Bitcoin lower yet. Note the Bitcoin chart below is from Friday but I’ve added the green arrow to illustrate today’s movement thus far… the red arrow shows what may happen if Friday’s lows give way.
Bitcoin has been running red-hot in 2017. Within its move higher, there have been some sharp, volatile pullbacks. Managing risk is important so it may be wise for traders to watch the recent lows (Friday, around $2950). They will tell us if this was just another steep pullback… or if something more ominous like an Eiffel Tower pattern is playing out.
Twitter: @KimbleCharting
Any opinions expressed herein are solely those of the author, and do not in any way represent the views or opinions of any other person or entity.


