 By Andrew Nyquist
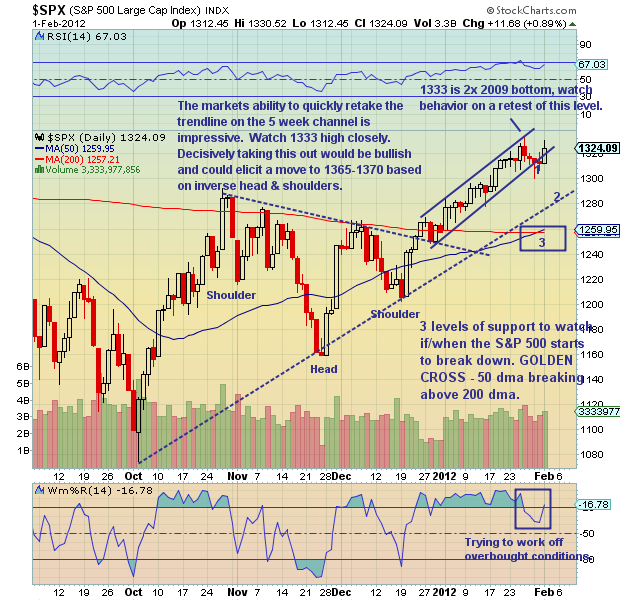
After hitting 1333 last Thursday, the S&P 500 reversed for 3 or 4 days. It looked like it was setting up for something ugly, as the major indices were reversing from elevated levels. But as I wrote about Tuesday, the market didn’t fall apart. In fact it withstood the selling pressure and re-grouped rather quickly. This show of strength neutralized the bears hopes temporarily and allowed the bulls to push the market higher yesterday: the index hit a high of 1330 before closing at 1324.
By not clearing the short term high of 1333, the S&P 500 made a lower high. This is something market pros and technicians will watch closely, today and in the days ahead. If the market can take this level out, and further push through 1333, it could make a move to 1365-1370 based on the inverse head and shoulders pattern (in chart below). But if 1330 holds as resistance, then the market may see some selling again. If/When this occurs, there are 3 near term levels of support.
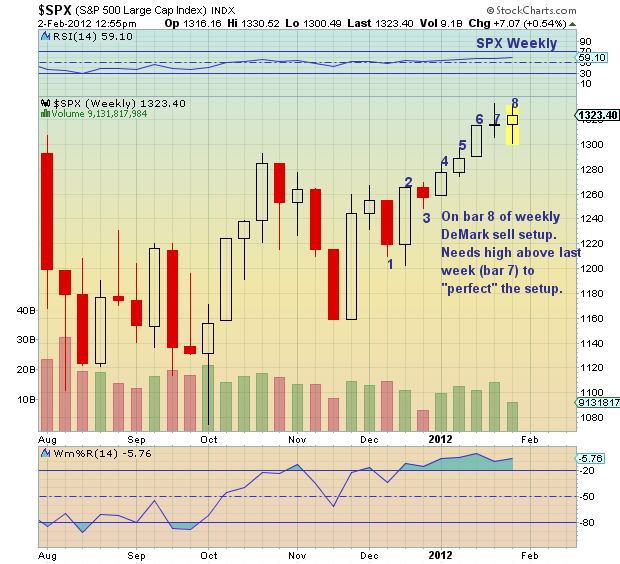
The daily chart below is a bit dizzying, so please forgive me. There is a lot of information running through my tired brain. After the Apple (AAPL) earnings blowout (see chartology), came the Facebook (FB) IPO announcement. What’s next? A deal with Greece? Keep an eye on Europe, as this would surely add another “pop” to the markets. But remember that markets tend to top on good news, not bad. This is also important to bear in mind being that the S&P 500 is on bar 8 of a DeMark weekly sell setup (see weekly chart). Signs point to a pullback, but whether it is now or in the next couple weeks is tricky business. Note that the weekly chart and previous 2 sentences were added intraday, post-publication.
Note as well that the 50 day moving average crossed above the 200 day moving average. This is technically called a golden cross. The media has made a lot of noise about this. Although I see this as a longer term bullish data point, I don’t put much stock in this. What is more important is that the 50 day moving average, as support, is moving higher.
———————————————————
Your comments and emails are welcome. Readers can contact me directly at andrew@seeitmarket.com or follow me on Twitter on @andrewnyquist or @seeitmarket. For current news and updates, be sure to “Like” See It Market on Facebook. Thank you.
Position in S&P 500 related short index fund SH.
Any opinions expressed herein are solely those of the author, and do not in any way represent the views or opinions of his employer or any other person or entity.


