In this week’s chart spotlight I want to share a couple charts with you regarding current credit conditions.
In the August report from the National Association of Credit Managers (NACM), its Credit Managers Index (CMI) ticked higher. But there were other data points within this report that caught our eye as well.
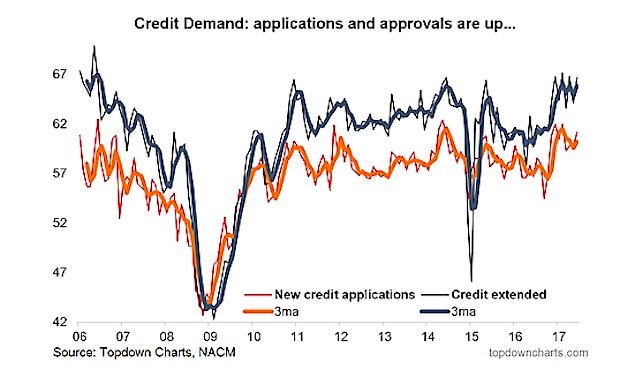
Two of my favorite indicators to follow regarding loan growth and demand are the Indexes for New Credit Applications and Amount of Credit Extended. Both indexes are shown in the chart below.
And both indexes have turned higher, meaning more loan applications are being approved and credit extended. Though we see risks for a correction near-term (due to Fed “tightening”), this reaccelerating should offset the impact.
New Applications & Credit Extended Chart
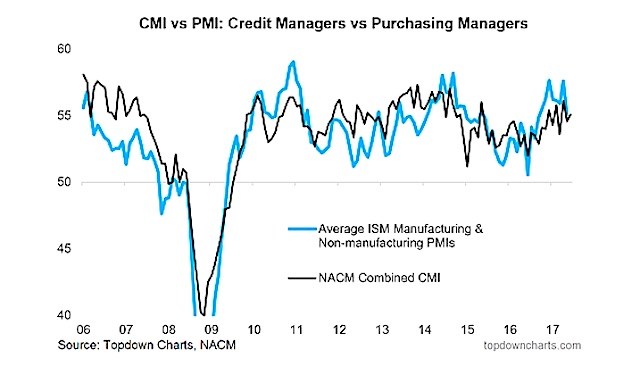
As well, when can look at the Credit Managers Index (CMI) vs Purchasing Managers Index (PMI) we can see that the economic conditions are still generally supportive.
CMI vs PMI Chart
Thanks for reading.
Twitter: @Callum_Thomas
Any opinions expressed herein are solely those of the author, and do not in any way represent the views or opinions of any other person or entity.


