“Valuations are still well below the peak of 1999” say the bulls.
They are certainly correct from an absolute basis but we caution that the current level of stock market euphoria is in a league of its own when compared to prior peaks on an “apples to apples” basis.
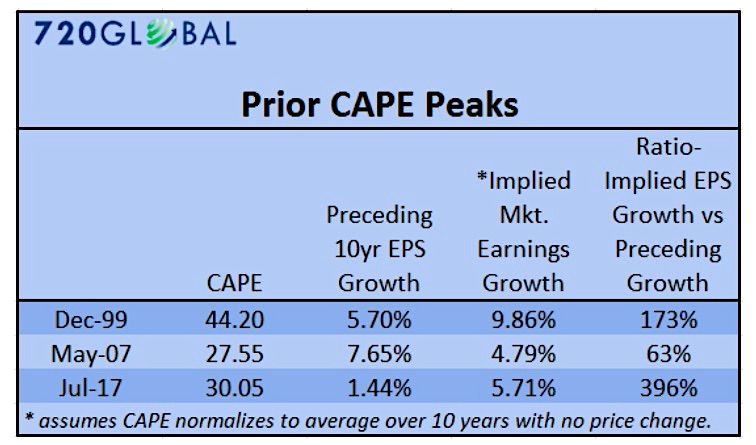
The following table compares earnings growth and implied market expectations for earnings growth from the two prior CAPE (Cyclically-Adjusted Price-to-Earnings) peaks to today.
CAPE is the price of an equity index, such as the S&P 500 Index (INDEXSP:.INX) in this case, divided by the average of ten years of earnings adjusted for inflation.
Implied market earnings growth is the rate of earnings growth required for the next ten years to return CAPE to its historical average assuming no price changes.
Earnings over the last ten years have grown significantly slower than during the prior episodes. Despite the weak trend in earnings per share (EPS) and economic growth (GDP), the market is implying earnings will grow at a much faster rate in the future.
In fact, the table highlights that EPS must grow almost 4x faster in future quarters than it has over the last ten years if CAPE is to normalize without price losses. That rate is more than double what investors required in 1999.
The table above makes an assumption worth noting. The data includes implied earnings growth under the assumption that the price of the S&P 500 will not change for ten years. If we assume prices rise at the historical average of 6% per year, then the EPS growth required to normalize CAPE is nearly 9%, or 80% greater than the EPS growth experienced over the last 100 years.
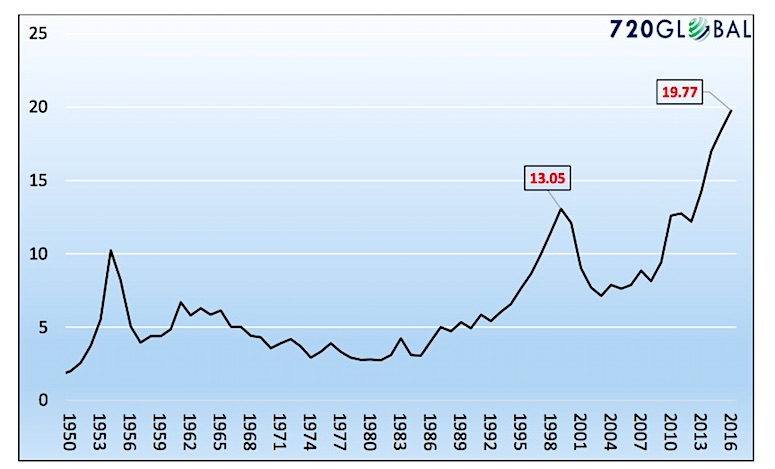
In Second to None, we compared CAPE valuations to GDP trends and came up with similar results as shown below.
When one compares current valuations and supporting economic fundamentals to data that preceded damaging market corrections, they may conclude, like us, that today’s equity market valuations may very well be the most egregious observed.
Like any illness, one cannot begin to treat a condition until it is properly identified. 720Global and many other astute market observers continue to produce compelling evidence that there are a variety of economic ills and gross mis-valuations with which investors must contend. The absence of consequences to this point seems to be broadly misinterpreted as “all’s well”. It is the medical equivalent of “the x-ray must be wrong because I feel fine.” The evidence argues otherwise just as it did in the months preceding 2000 and 2008.
Twitter: @michaellebowitz
Any opinions expressed herein are solely those of the author, and do not in any way represent the views or opinions of any other person or entity.


