In this week’s investing research outlook, we analyze the technical setup and trends of the S&P 500 Index (INDEXSP:.INX), key stock market trends and indicators, and discuss emerging themes and news that we are watching closely in our investing research.
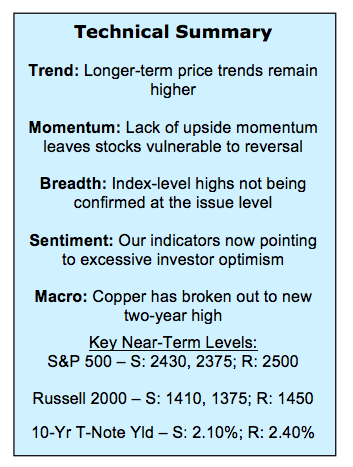
Here’s a summary of our findings for the week ending August 4, 2017:
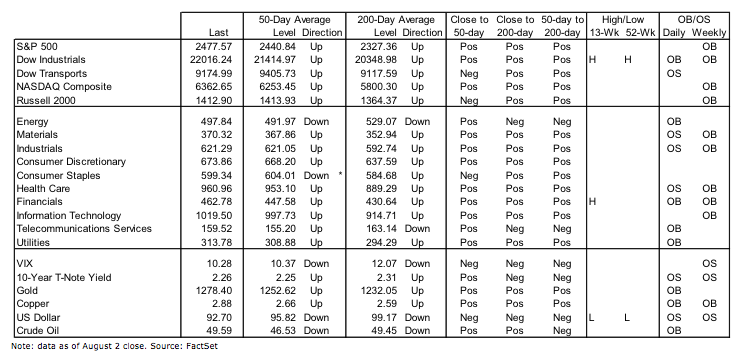
Large-Caps Holding Near Highs – The Dow Jones Industrials cross above 22,000 has generated plenty of celebratory headlines, but it has not been joined by its domestic counterparts in making new highs. Both the S&P 500 and the NASDAQ Composite (INDEXNASDAQ:.IXIC) have held near their recent peaks, although they have done so in the context of waning momentum.
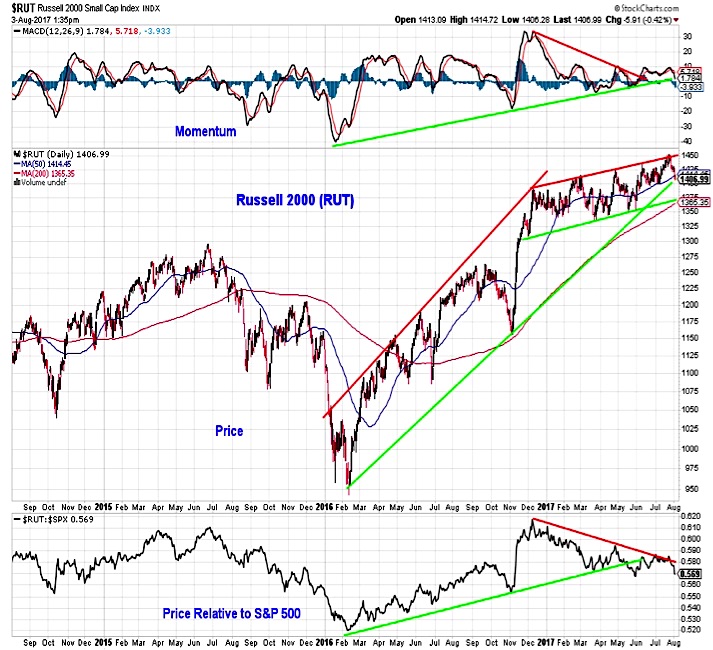
Small-Caps Struggling – The small-cap Russell 2000 (INDEXRUSSELL:RUT), however, has seen absolute and relative price weakness. The Dow Industrials have made six consecutive new highs, while the Russell 2000 has closed down on five of those days. The relative price trend off of the early 2016 lows has already broken down, and the momentum and absolute price trends are being tested.
Breadth Trends Improving Although Near-Term Conviction Lacking – Our industry group trend indicator is again rising, and has moved to its highest level since March. This positive breadth backdrop could be tested as short-term measures of rally participation offer a more cautious message. The percentage of stocks trading above their 50-day and 200-day averages, while still elevated, is waning, and relatively few stocks have been making new highs.
Stock Market Indicators
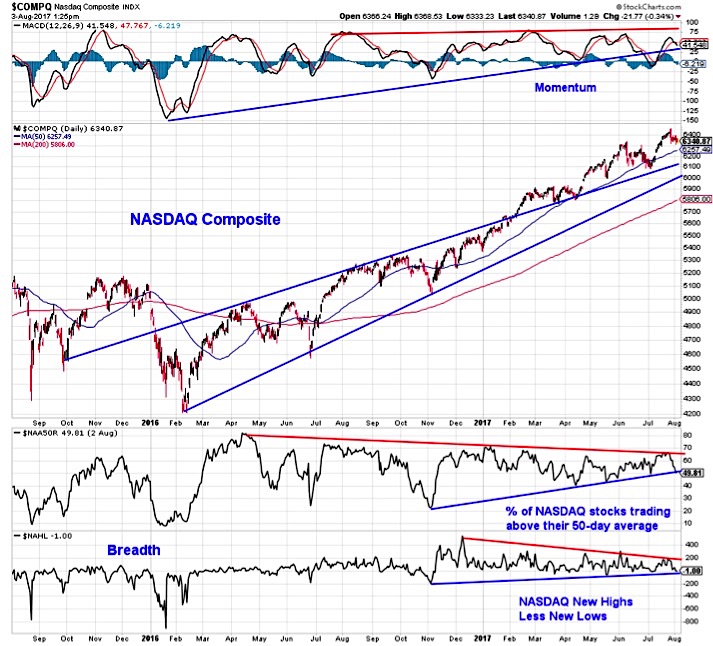
Nasdaq Composite
The chart for the NASDAQ Composite shows a similar picture. New prices over the past two months that are unconfirmed by momentum and have not been accompanied by a surge in new highs or the percentage of stocks trading above their 50-day averages. Further deterioration in these breadth indicators could suggest that near-term correction risk is rising.
Russell 2000 Index
The Russell 2000 did make a new all-time high in July, but after failing at resistance it has moved quickly to test price support. Despite several attempts this year, small-caps have been unable to re-assert the relative leadership that emerged in 2016.
S&P 500 Index
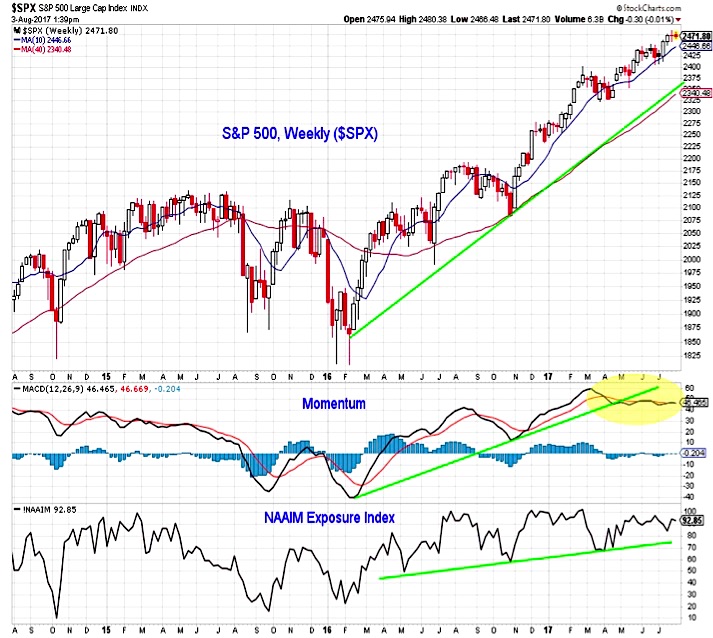
The up-trend that emerged off of the early 2016 lows (and which was tested in July and November last year) remains intact for the S&P 500. Momentum has deteriorated and optimism has increased as we have moved through 2017. This could leave the rally in need of a respite and vulnerable to a reset. A move down toward support near 2375 could help relieve some optimism and set-up the next leg of the rally.
continue reading this article on the next page…

