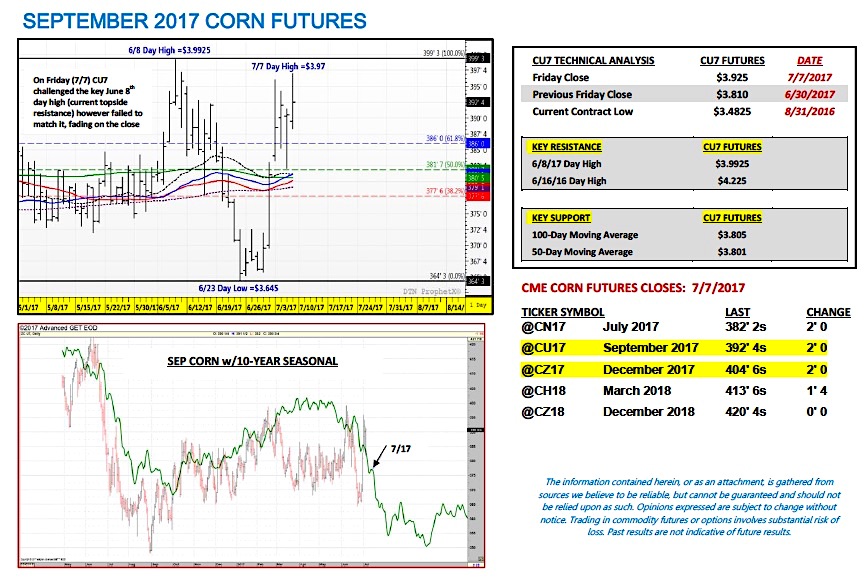
September corn futures moved sharply higher this week, closing up 11 ½-cents per bushel week-on-week, finishing on Friday (7/7) at $3.92 ½.
September corn futures rallied aggressively for the second consecutive week however failed on Friday to take out the current summer high of $3.99 ¼ established on June 8th.
Weekly Corn Price Drivers:
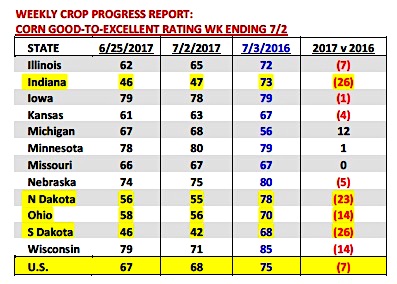
U.S. Corn Crop Ratings: Monday’s Crop Progress report showed the U.S. corn good-to-excellent rating improving somewhat unexpectedly 1% week-on-week to 68% as of the week ending July 2nd compared to 75% in 2016. The trade was expecting to see a slight decrease in ratings following a week of hot and dry conditions most notably in the Western Corn Belt. The major corn producing states heading backward largely remained unchanged including North Dakota, South Dakota, and Indiana. I would now add Ohio to that list. Collectively those four states accounted for approximately 2.81 billion bushels of production in 2016, which was just slightly more than the 2.74 billion bushels Iowa produced on its own a year ago.
Therein lies the problem…the top 4 corn producing states in the U.S. (Iowa, Illinois, Nebraska, and Minnesota) aren’t perfect but they aren’t bad either and they represent the bulk of the total U.S. corn crop (accounted for 54% of total U.S. corn production in 2016). Of those 4, I think the biggest surprise was that Nebraska saw its rating actually improve week-on-week, which appeared unlikely given hot and dry conditions now enveloping large sections of Nebraska along with the Dakota’s. That said the impact of “droughts” in Nebraska has always been a tough read considering approximately 58% of the corn acres planted in NE are irrigated (2016 irrigated acres in NE = 5.762 million versus 9.85 million total planted). Corn Bulls will have to wait another week to see if the heat pushing into Nebraska, as well as, the western halves of Iowa and Minnesota starts to have an effect on those states’ good-to-excellent ratings over time…
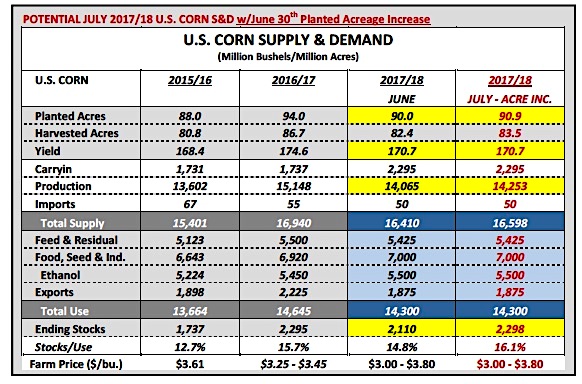
Expectations for U.S. Corn S&D in the July WASDE Report: Next Wednesday (7/12) the USDA will release its July 2017 WASDE report, which will reflect the USDA’s recent revisions to planted acreage from its June 30th Acreage summary. In that report the USDA increased 2017/18 U.S. planted corn acreage to 90.886 million acres (harvested 83.5 million) versus its March Prospective Plantings forecast of 89.996 million acres (harvested 82.4 million). Assuming the USDA leaves the U.S. corn yield unchanged versus its June yield estimate of 170.7 bushels per acre, total U.S. corn production would increase to 14.253 billion bushels versus 14.065 billion in June (+188 million month-on-month). Once again the upward adjustment in production would solely be attributed to the increase in planted and harvested U.S. corn acreage.
Will the USDA lower its U.S. corn yield projection in the July WASDE report? History would suggest the probability of a downward adjustment to the U.S. corn yield is unlikely. Over the last 10-years the USDA has only lowered the U.S. corn yield twice versus its June forecast in the July crop report. In 2012 the USDA made a -20 bushel per acre yield reduction, however that summer represented one of the worst U.S. corn droughts in modern history. The other July yield decrease came in 2008, which was only a relatively inconsequential -0.5 bpa. That said at best I think Corn Bulls expecting anything more than possibly a -1 bpa yield decline will be disappointed. With the U.S. corn crop rated 68% good-to-excellent as of the week ending July 2nd that’s still nearly equivalent to the 2015 U.S. corn good-to-excellent rating of 69% as of the week ending July 5th. The 2015/16 crop-year produced a final U.S. corn yield of 168.4 bushels per acre.
For the sake of the argument if the USDA lowers the U.S. corn yield -1 bpa in next week’s July WASDE report, total U.S. corn production would still increase 105 million bushels month-on-month due to larger planted acreage. Point being…Corn Bulls might be forced to wait until the August WASDE report to get a more tangible, market moving yield decline from the USDA. At present, barring an increase to total U.S. corn demand, 2017/18 U.S. corn ending stocks are likely heading higher not lower in the July crop report (June 2017/18 U.S. corn ending stocks = 2.110 billion bushels).
KEY CORN FUTURES PRICING CONSIDERATIONS FOR THIS WEEK:
Corn Futures now in a full-fledged weather market. The race is officially on by a host of grain market analysts of varying shapes, sizes, and credibility to see who can kill the U.S. corn crop first. This is not atypical behavior during the summer months; however this year’s “drought” rhetoric feels to be even more amplified due in large part to the fact that corn (and soybeans) futures have been stuck in approximately a 3-year cycle of seemingly never-ending “cheap” prices. Therefore nearly everyone is cheering for a major corn rally.
As a point of reference the last time front month corn futures traded above $5.00 per bushel was in May 2014. That said here’s my attempt to evaluate this current corn rally rationally, such that pricing opportunities are taken advantage of versus the traditional alternative of “doing nothing” only to then see prices collapse seemingly overnight. This happened in 2015 with Sep corn futures trading up to a day high of $4.43 ¼ on 7/14 (presumably heading to $5.00); 12-trading sessions later Sep con futures were making a day low of $3.65 ¾. “Doing nothing” is not a trading strategy and the consequences are often painful…both financially and emotionally.
- If you’re bullish corn you’re betting that the current hot and dry conditions in the Western Corn Belt continue to inch into both Minnesota and Iowa. At present Twitter will gladly provide all the pictures a Corn Bull needs to satisfy his/her longing to justify that crop conditions are currently fading in the Dakota’s, Nebraska, and now sections of Minnesota/Iowa. However ultimately Corn Bulls will need to see this perceived crop deterioration reflected in the USDA’s Weekly Crop Progress reports. That makes next Monday’s Crop Progress update incredibly important to Corn Bulls. To sustain the rally that report needs to show the aforementioned states moving backward with an underlying bias that this pattern will persist due to the continuation of the hot/dry “Ridge” in the Western Corn Belt.
- If you’re of the opinion that this rally should be sold you’re betting that the 5 and 10-year seasonal pricing patterns in September corn futures will once again hold, both of which strongly suggest July rallies are ultimately unsustainable. You’re also banking on large 2017/18 U.S. corn carryin stocks along with the June 30th planted acreage increase more than offsetting a U.S. corn yield possibly heading 2 to 3 bpa lower over time versus the USDA’s June forecast of 170.7 bpa.
Thanks for reading.
Twitter: @MarcusLudtke
Author hedges corn futures and may have a position at the time of publication. Any opinions expressed herein are solely those of the author, and do not in any way represent the views or opinions of any other person or entity.
Data References:
- USDA United States Department of Ag
- EIA Energy Information Association
- NASS National Agricultural Statistics Service


