S&P 500 Trading Outlook (2-3 Days): Currently at make-or-break levels
The S&P 500 (INDEXSP:.INX.INX) is at a make-or-break level after pullback to test the lows of the range. The NASDAQ (INDEXNASDAQ:.IXIC) lies right near June lows, and any further decline on Friday/Monday would likely bring about weakness next week.
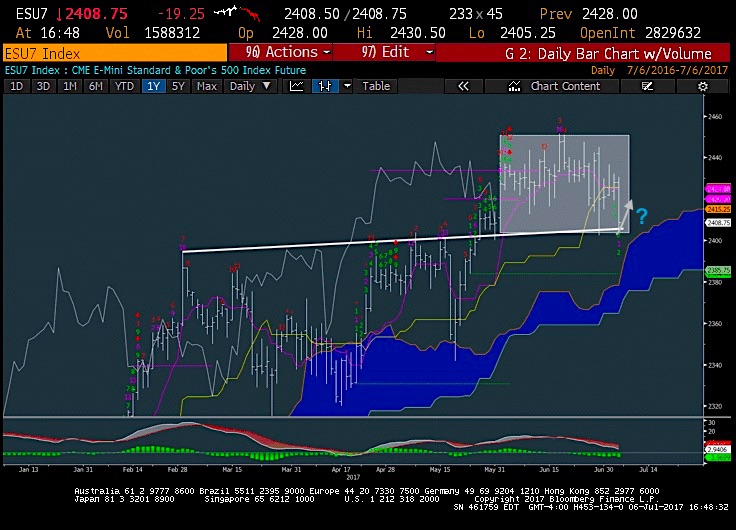
Holding the line here is key for the NASDAQ Composite (and the stock market as a whole). The S&P 500 is at key levels too, with 2400-2 being an important hold near-term. A move below that will bring on 2385. A move above 2436 would allow for a test of recent range highs.
S&P 500 futures are rallying this morning on the heels of a positive jobs report. But, as you can see in the chart below, the decline yesterday hit key support levels.
S&P 500 Futures Chart (showing yesterday’s deep price test)
Technical Thoughts
The Trend at this point is in jeopardy yet again of potentially turning bearish, led by Technology breaking down under June lows while the S&P 500 and Dow Jones Industrials flirt with make-or-break territory.
A few warning signs were present in the last few days, when indices recorded their positive session earlier in the week, while showing nearly 2/1 volume to the downside and more stocks declining than advancing. Equity Put/call ratios had been showing readings near lows at just above 0.50. Meanwhile Technology has been demonstrating some of the more bearish near-term technical patterns than have been seen in the last year, with repeated advances failing and pulling back sharply to test the lows. In the next few trading days, all eyes will be on Tech.
Below are the positives and negatives of the current market environment for traders.
The positives:
1). Structure
2). Sentiment (contrarian)
3). Sector Rotation
4). Very low volatility near the highs; and
5). Equal-weighted SPX making minor breakouts vs Cap-weighted SPX.
The negatives:
1). Weekly negative momentum divergence and deterioration
2). Confirmed Weekly Demark TD 13 Sell signals on SPX, NASDAQ
3). Technology weakness
4). Europe dropping off relatively vs SPX
5). Breadth concerns with only 60% of stocks above their 50, 200 day, while 55% are above their 10-day ma
6). Small-cap and Mid-cap indices still haven’t really moved back to new high territory (SML, and MID) and have traded range-bound for six months.
7). Low Put/call readings for equities and
8). Seasonality/cycle concerns.
Overall, equity indices have pulled back to near-term make-or-break territory, so the ability to hold will be critical going into next week. Technology in particular looks like a very important piece to the puzzle given that it represents 22%, or nearly 1/4 of the entire market capitalization for the S&P 500. Breaks of June lows in the NASDAQ and Tech sector ETFs along with S&P breaching 2400 is what to watch for – this would turn the trend negative into next week. For the bulls, there is little wiggle room.
Thanks for reading.


