THE BIG PICTURE – What’s Ahead?
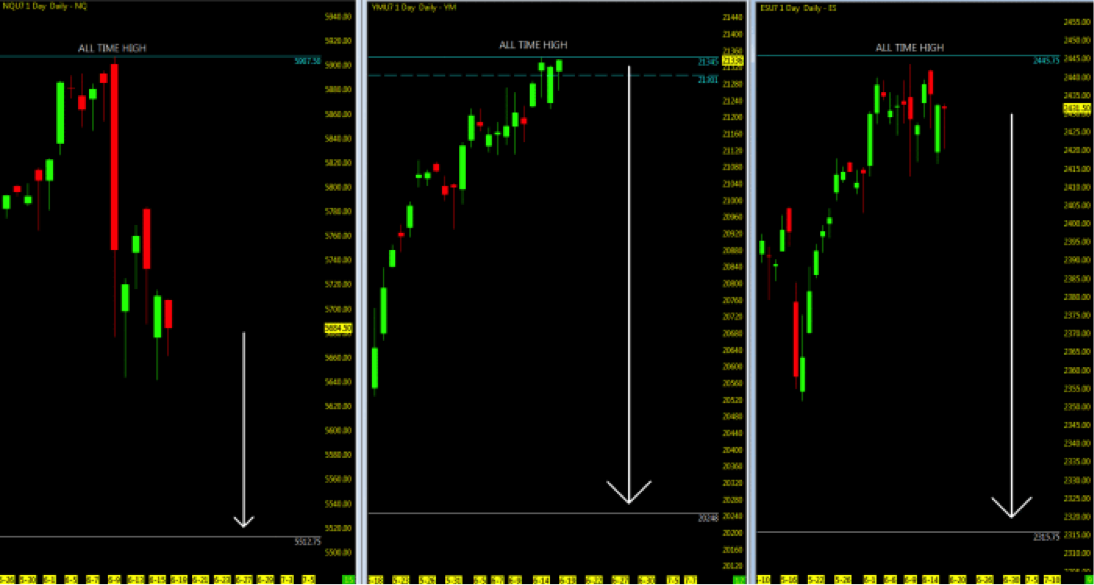
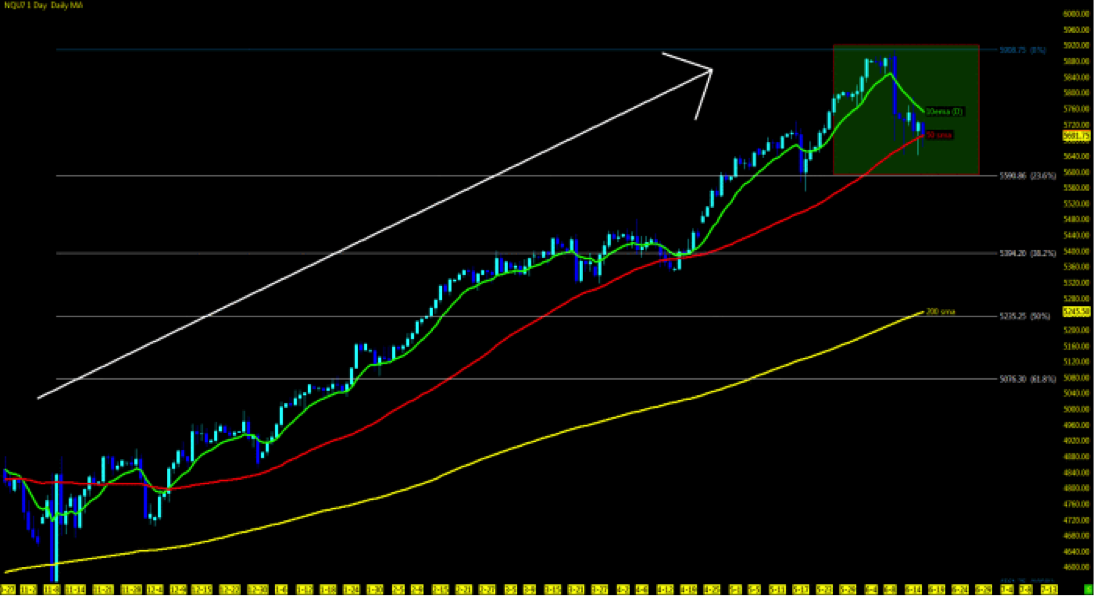
The Dow Jones Industrial Average (INDEXDJX:.DJI) and S&P 500 (INDEXSP:.INX) held and closed above their weekly opens while the Nasdaq (INDEXNASDAQ:.IXIC) pulled back to close out its next open gap before finding support near the the 50 day moving average.
The Dow Jones remains the strongest of the big 3 stock market indices, but together with the S&P 500, they maintain strong uptrends; both are holding above the mid-term 50 period and short term 10ema moving averages (a full recap which may be found here).
The Volatility Index (INDEXCBOE:VIX) remains in the 10-11’s as we head into week 25 and volume has shifted to the September contract… are the doldrums of summer here… or not? Permabears are starting to beat on their drums that this is the end game and we have no further momentum to maintain our uptrend continue to hit the airwaves.
AMZN coming out on Friday with a buyout of Whole Foods gets a 23 point boost as it tracks back to its highs above 1000. FANG stocks now being referred to as the FAAMG group taking the brunt of the NQ slap downside as markets reassess portfolio exposure to these “too big” to fail stocks which seem to maintain a large percentage of the index gains for 2017. It appears the case that can be made is that “things” are not that great from the weekly economic data but they also are not in a catastrophic bubble that has burst yet. Whatever the catalyst is that we have created for ourselves, seems to be holding up the status quo and while the tech industry took a pullback in the last several weeks, overall momentum is maintaining its uptrend structure. Be it political or economic fallout which is what it may take for the market to drive any deeper, Q2 earnings will surely be the next telltale of where we are headed next and surely if the NQ regains its traction upside.
Technically, the open gaps which remain below and closest on Nasdaq futures (NQ) downside are all targets sitting on the indices backside (I can almost see the drooling of the short sellers ready to close them out). The focus as the S&P 500 futures (ES) consolidates will be on the short term 10ema. Consolidation surely leads to a breakout of either direction and momentum remains at the highs.
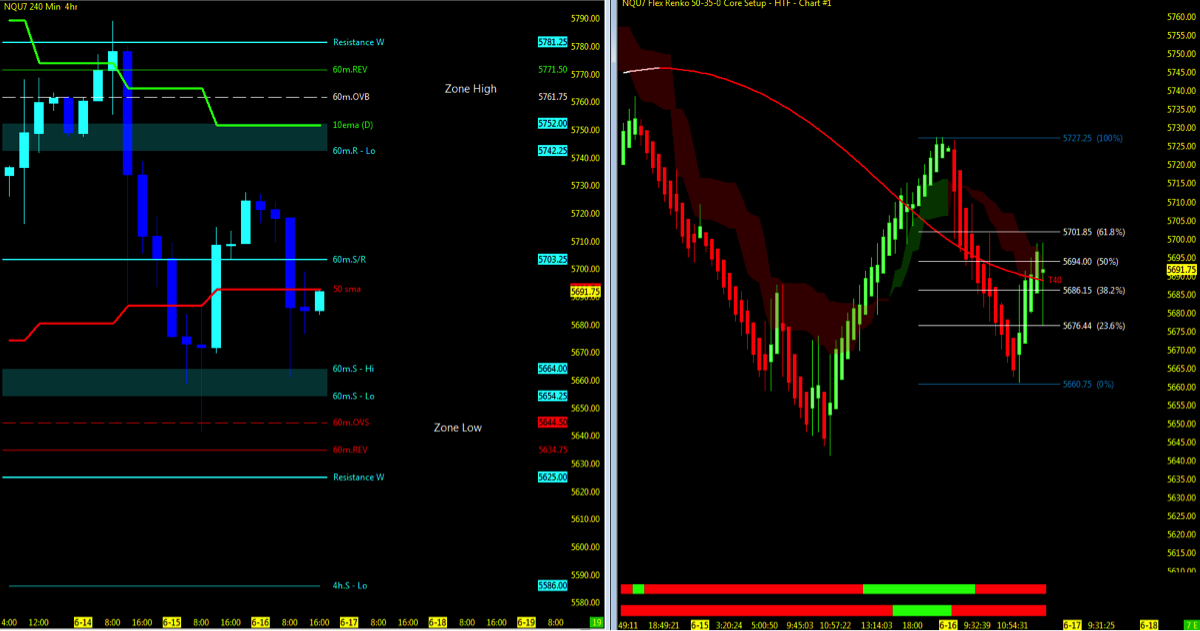
Nasdaq futures (NQ) which struggles at the daily 50 moving average and encapsulated in a range bound chop of the 10/50 averages leads momentum into week 25 to the short on a 50% pullback of Friday’s price action. Market place semi-loss of enthusiasm which has not helped the cause for the FANG/FAAMG stocks, may just be what holds it down. What the average trader simply wants to be told is that this is the bottom and that the long position looks profitable. I say, read the charts and recognize that the NQ has had a valid technical “healthy” pullback and that any further pullback would be to the 200ma and 50% daily fib level. Otherwise, we hold here until momentum swings back above the 10ema and regains the upper highs.
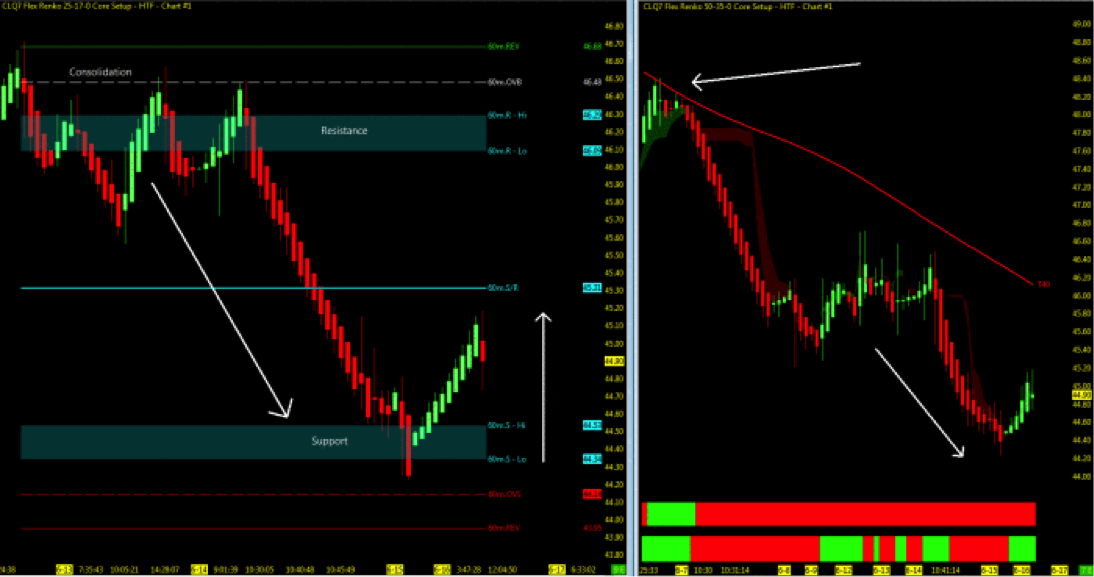
Crude Oil closing out the 44.25 gap and one below at 43.81 continues to struggle to gain traction back upside above the 10ema. Trend momentum maintains its downward pressure. Retest back upside to break the T3 -40ema and back above the 10ema will look to the 50ema at 48-49. Bigger pic momentum remains down on crossover setup at 50.06
Gold which struggles to regain the highs of 2016, momentum remains downside as it has been unable to hold above it’s key moving averages yet above the daily 200ma. Fib 50% pullback at 1256 will be the level to watch down to 61.8% and/or regain traction back above the 10ema. Bigger picture momentum remains upside with the short-term looking down.
Key events in the market this week include FED speakers, PMI, and Brexit talks. Light econ data.
Note that you can also view my market outlook on YouTube. Markets Covered: ES, YM, NQ, GC, CL, 6J, 6E
THE BOTTOM LINE
Look for Nasdaq futures (NQ) to break out of 10/50 moving average range bound chop. A break above the 50ma will point to the highs of last week and a daily MML reversal. A 70 point move to regain traction above the 10ema will be the challenge for the NQ as the short term higher time frame momentum has shifted to the downtrend. Deeper pullbacks will look for Daily MML support, 200ma and open gaps.
S&P 500 and Dow Jones are maintaining momentum upside, watch for any short term correction to fall below the 10ema to drop to the 50ma. If price action maintains above the 10ma, retesting the all time high of week 23/24 and breaking above will look for daily MML high levels.
Attempting to determine which way a market will go on any given day is merely a guess in which some will get it right and some will get it wrong. Being prepared in either direction intraday for the strongest probable trend is by plotting your longer term charts and utilizing an indicator of choice on the lower time frame to identify the setup and remaining in the trade that much longer. Any chart posted here is merely a snapshot of current technical momentum and not indicative of where price may lead forward.
NQ – Nasdaq Futures
Technical Momentum: UPTREND PULLBACK
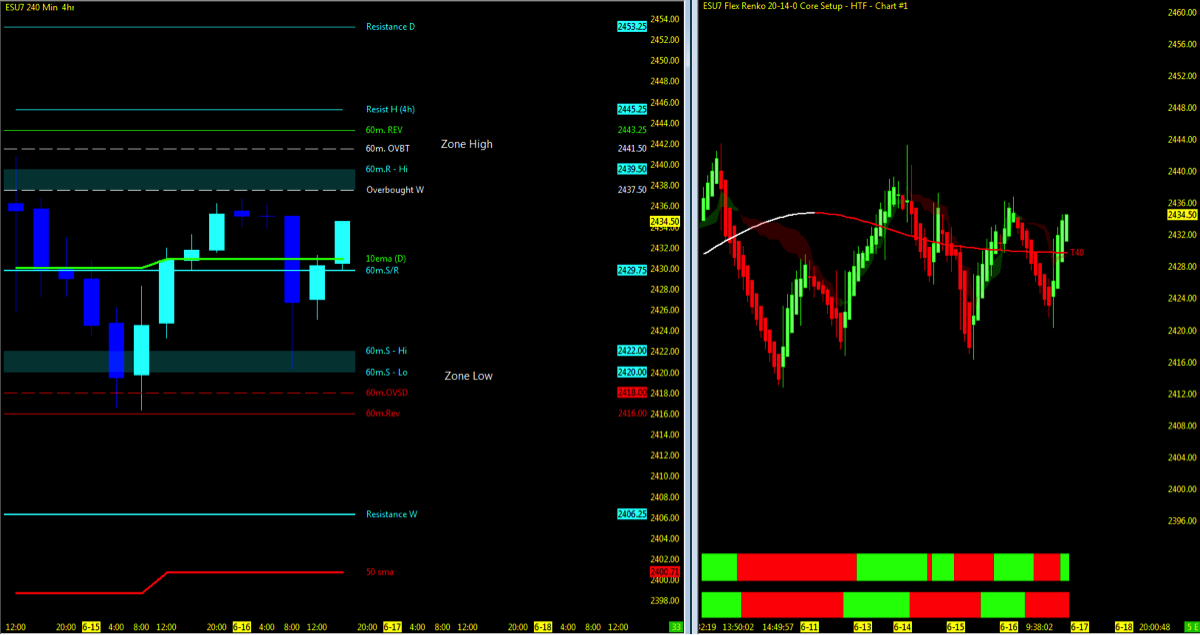
Using the Murray Math Level (MML) charts on higher time frames can be a useful market internal tool as price action moves amongst fractal levels from hourly to daily charts. Confluence of levels may be levels of support/resistance or opportunities for a breakout move.
Multiple MML Overlay (4hr with 60m/Daily/Weekly and Range)
- Lowest Open Gap: 4017
ES – S&P Futures
Technical Momentum: UPTREND
Multiple MML Overlay (4hr with 60m/Daily/Weekly and Range)
- Lowest Open Gap: 1860.75
Thanks for reading and remember to always use a stop at/around key technical trend levels.
Twitter: @TradingFibz
The author trades futures intraday and may have a position in the mentioned securities at the time of publication. Any opinions expressed herein are solely those of the author, and do not in any way represent the views or opinions of any other person or entity.

