Stock Market Futures Considerations For May 30, 2017
The futures markets are pointing slightly lower this morning after the long holiday weekend. The first test of support for the S&P 500 (INDEXSP:.INX) should hold but be sure to know your levels. More below.
Check out today’s economic calendar with a full rundown of releases. And note that the charts below are from our premium service at The Trading Book and are shared exclusively with See It Market readers.
S&P 500 Futures (ES)
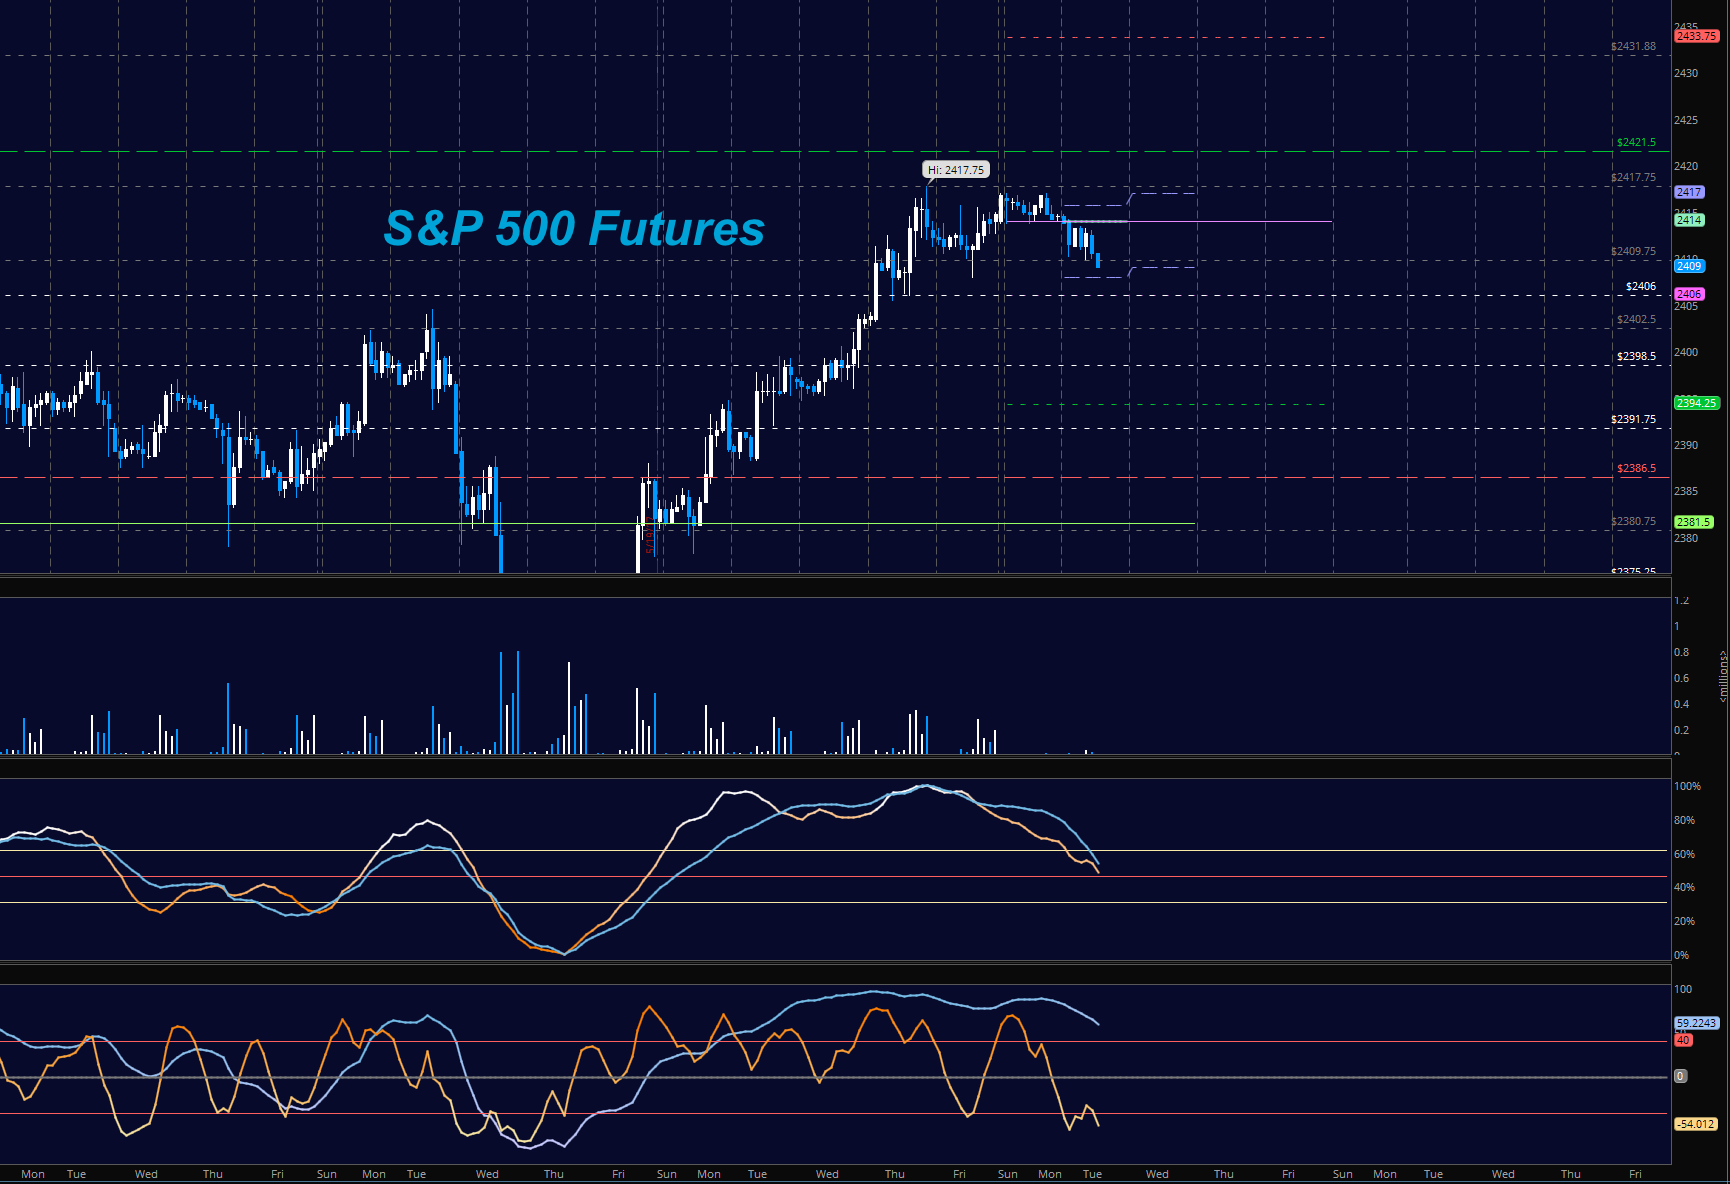
The morning begins with a bearish draft that is testing first support at 2409, and could easily come into 2402.5 before buyers attempt a bounce. Charts are still in a breach formation under generally bullish momentum, meaning that the first pass tests into support will bring buyers once more. Short trades are also still dangerous here without proper signaling from price action, but there seems to be more of that present at this time. The key event will be lower highs and a breach below of key support to signal any continuing bearish action. The bullets below represent the likely shift of trading momentum at the positive or failed retests at the levels noted.
- Buying pressure intraday will likely strengthen above a positive retest of 2414.5 (though that is resistance for now)
- Selling pressure intraday will likely strengthen with a failed retest of 2402.25
- Resistance sits near 2414.5 to 2417, with 2421.5 and 2427.75 above that
- Support holds between 2402.5 and 2395.5, with 2391.5 and 2386.75 below that
NASDAQ Futures (NQ)
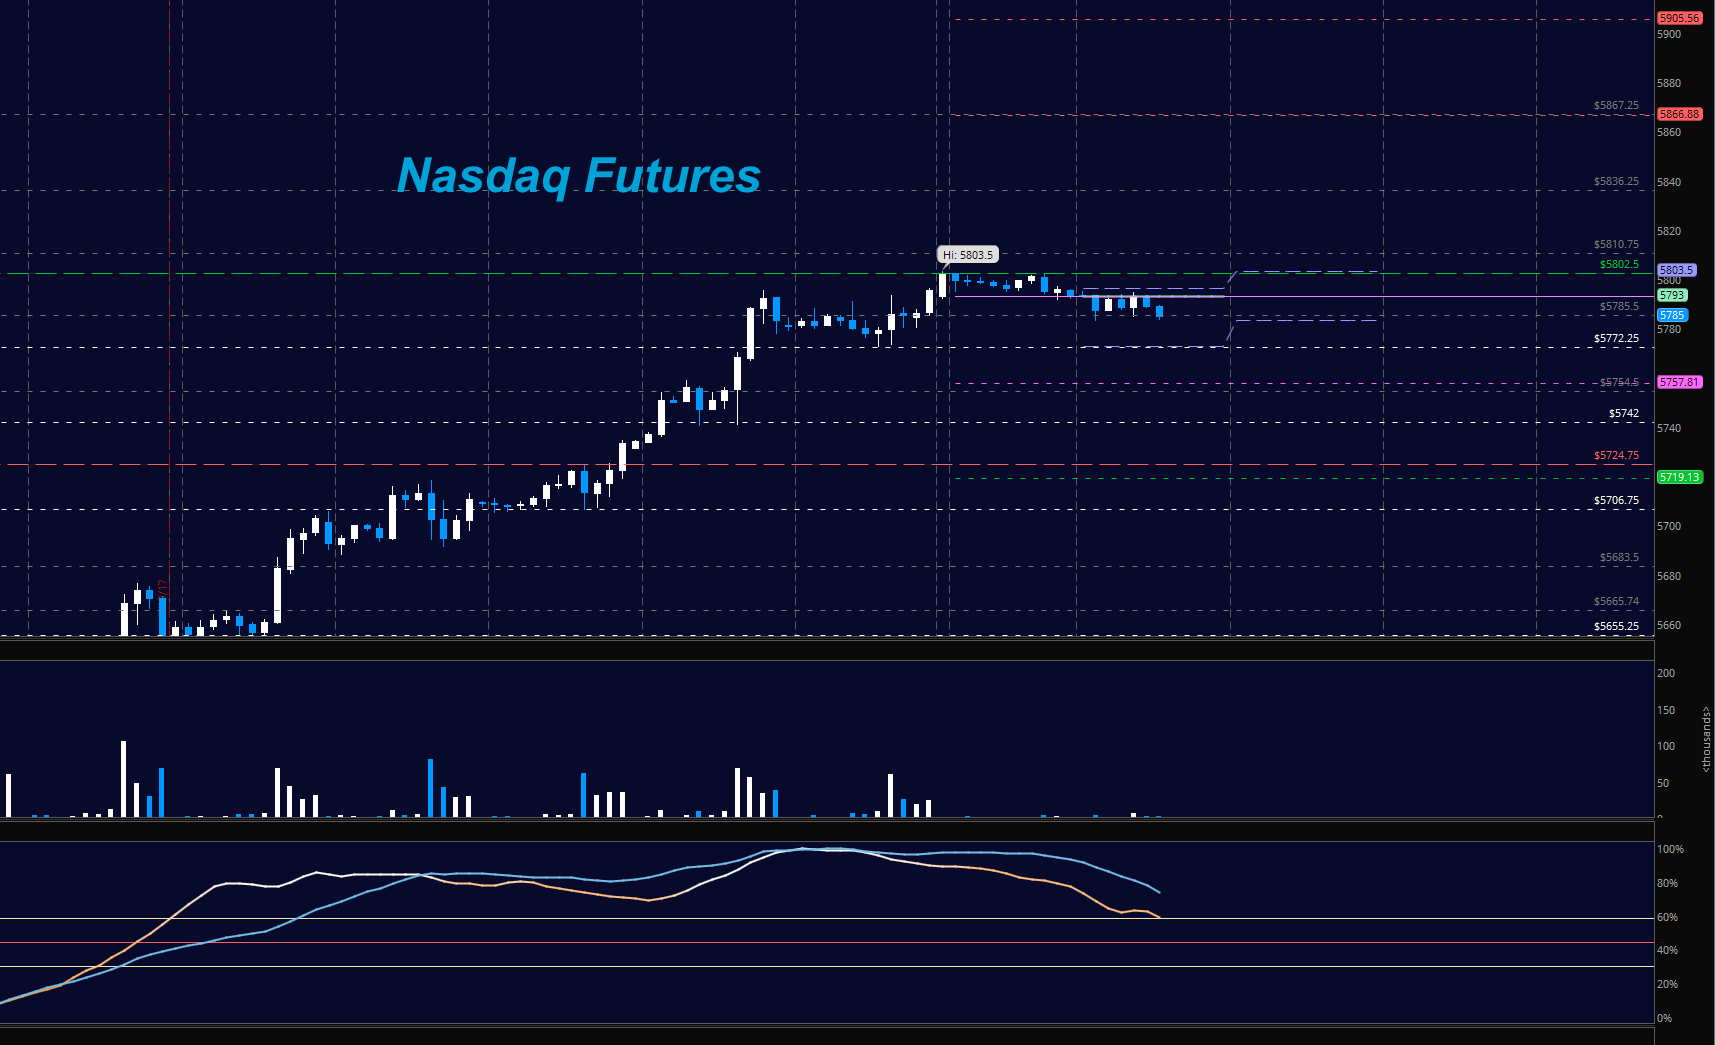
Mild topping formations are showing in the NQ here on tighter timeframes as daily charts still show that pullbacks will be bought. The key to watch will be the higher lows and the potential loss of tested support. There still appears to be too much buying interest for this chart to collapse without first trying to bounce. Outside of news or some elemental catalyst, that is. The bullets below represent the likely shift of trading momentum at the positive or failed tests at the levels noted.
- Buying pressure intraday will likely strengthen with a positive retest of 5793.5
- Selling pressure intraday will likely strengthen with a failed retest of 5772.25
- Resistance sits near 5793.5 to 5796.25, with 5802.5 and 5810.75 above that
- Support holds between 5772.25 and 5757.5, with 5742 and 5720.5 below that
Crude Oil –WTI
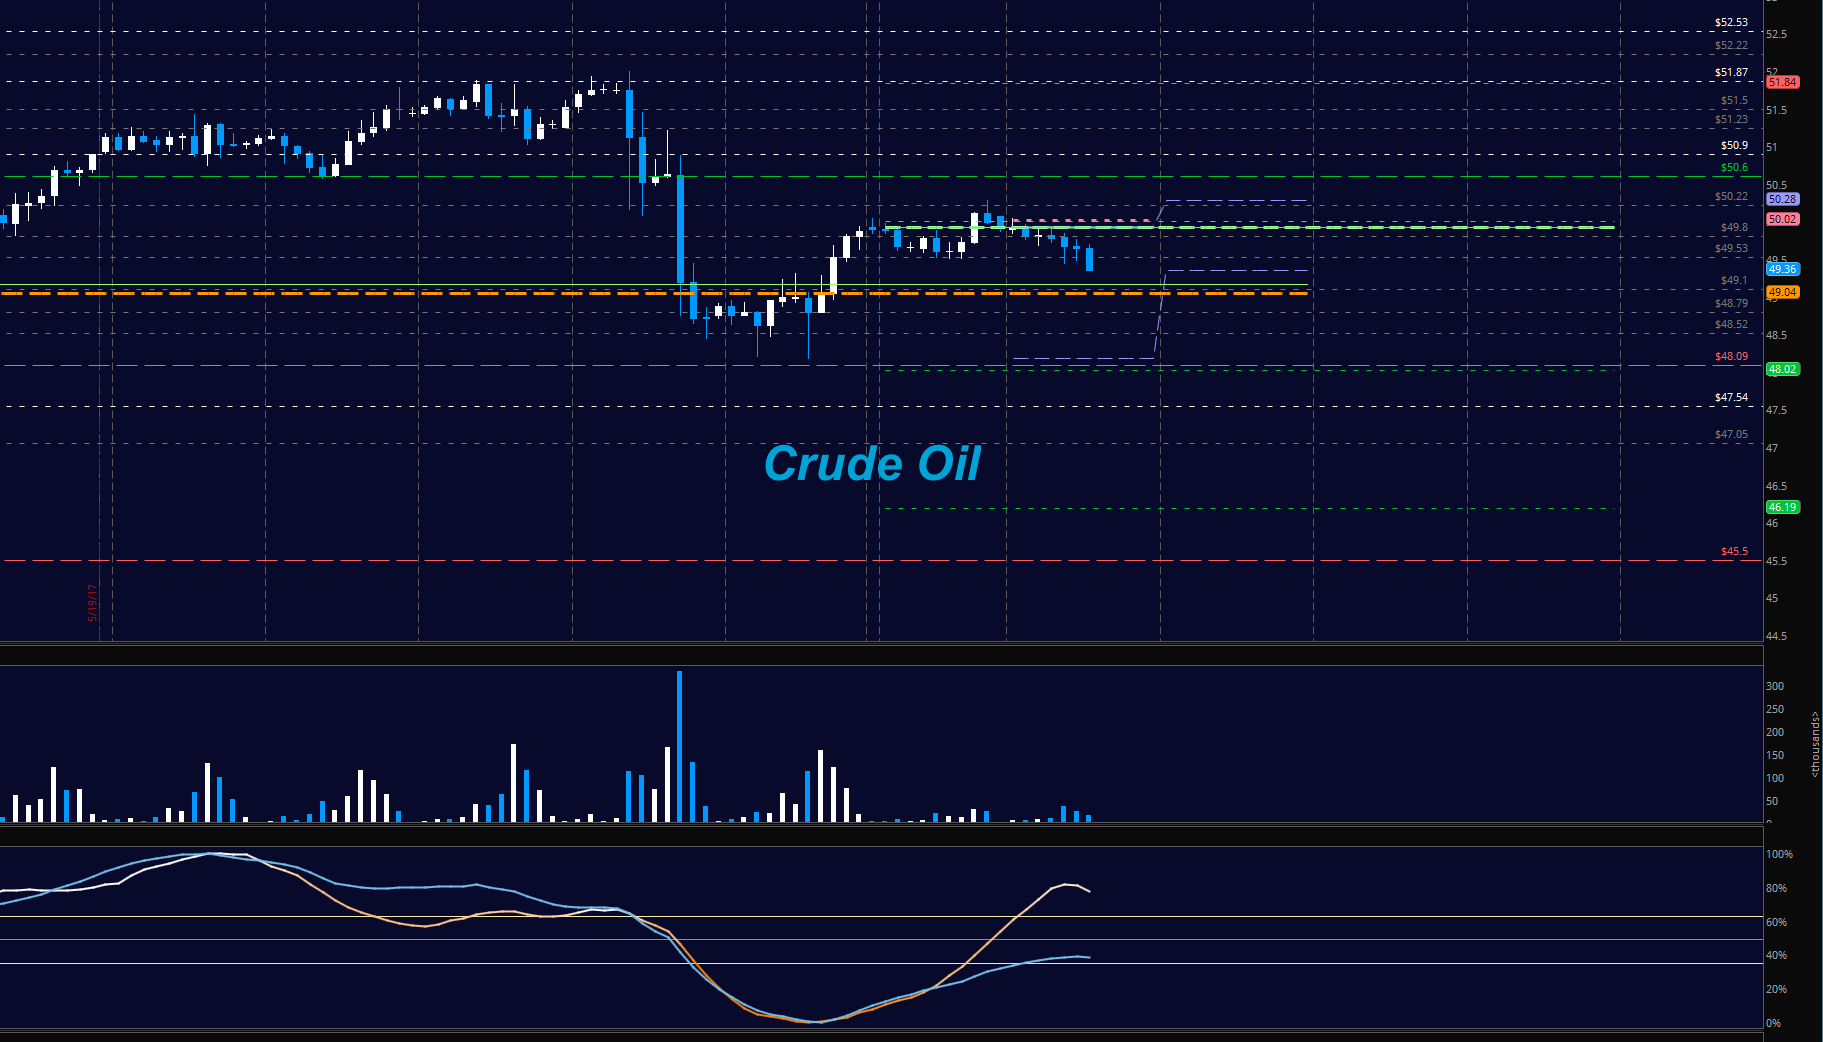
The failure to breach 51.9 last week was a signal to watch for weakening momentum and true to form, the traders could not hold support zones as we drifted lower. We are now very close to weekly and monthly congestion levels. Now the litmus test will be the behavior at 49 where a failure to hold will bring value buyers into the fray. The bullets below represent the likely shift of trading momentum at the positive or failed tests at the levels noted.
- Buying pressure intraday will likely strengthen with a positive retest of 50.28
- Selling pressure intraday will strengthen with a failed retest of 49.09
- Resistance sits near 50.28 to 50.6, with 51.23 and 51.87 above that
- Support holds between 49.15 and 48.79, with 48.52 and 48.14 below that.
Our live trading room is now primarily stock market futures content, though we do track heavily traded stocks and their likely daily trajectories as well – we begin at 9am with a morning report and likely chart movements along with trade setups for the day.
As long as the trader keeps himself aware of support and resistance levels, risk can be very adequately managed to play in either direction as bottom picking remains a behavior pattern that is developing with value buyers and speculative traders.
Twitter: @AnneMarieTrades
The author trades stock market futures every day and may have a position in mentioned securities at the time of publication. Any opinions expressed herein are solely those of the author, and do not in any way represent the views or opinions of any other person or entity.


